

SNXUSDT
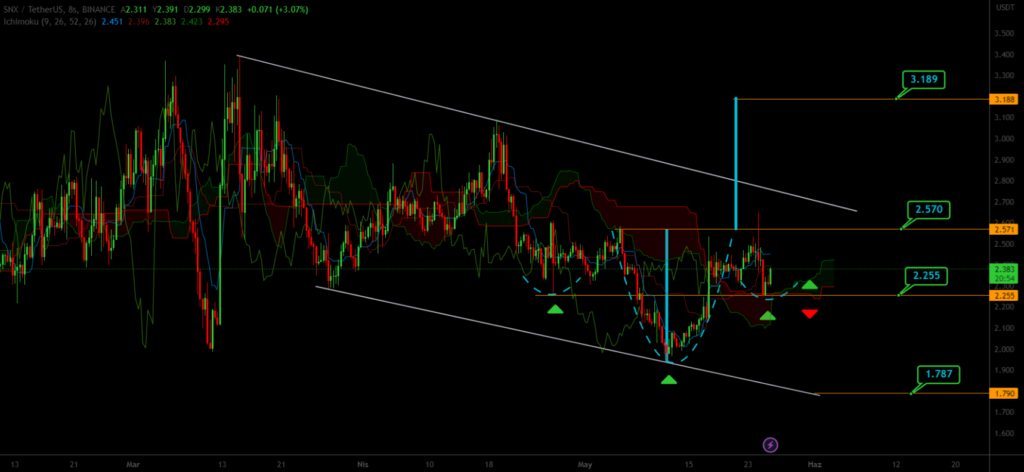
When examining the 8-hour chart of SNXUSDT, it is observed that price movements continue within a formation known as a “Tobo” pattern. In case the cryptocurrency experiences price movements below the level of 2.255, it is evaluated that there is a possibility of a retracement towards the level of 1.787. However, if the price movements remain above the level of 2.255, it is considered that there is a potential for surpassing the level of 2.570 and targeting the level of 3.189.
SHIBUSDT
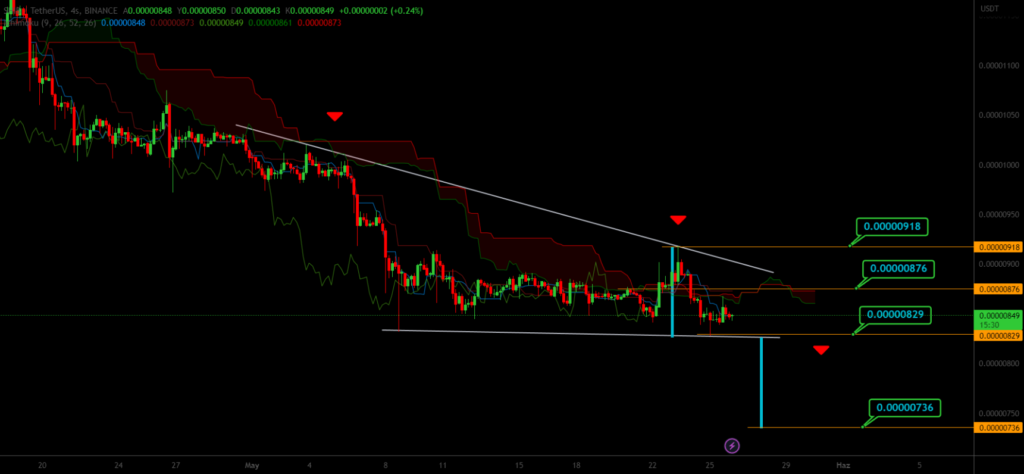
When examining the 4-hour chart of SHIBUSDT, it is observed that price movements continue within a descending wedge formation. Unless the cryptocurrency surpasses the level of 0.00000918, it is evaluated that there is a possibility of a retracement towards the level of 0.00000829, breaking below the level of 0.00000876, and potentially reaching as low as 0.00000736.
ADAUSDT
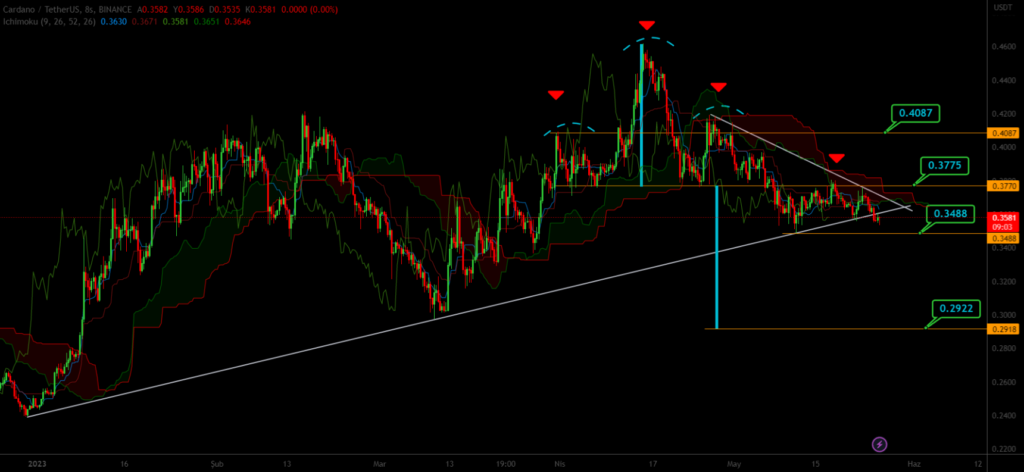
When examining the 8-hour chart of ADAUSDT, it is observed that price movements continue within a Head and Shoulders formation. Unless the cryptocurrency surpasses the level of 0.4087, it is evaluated that there is a possibility of a retracement towards the level of 0.3488, breaking below the level of 0.3775, and potentially reaching as low as 0.2922.