

SHIBUSDT
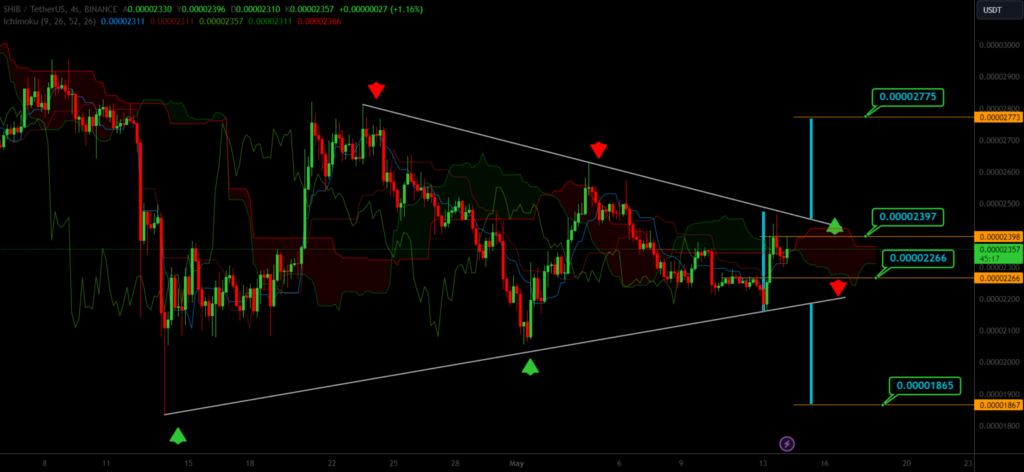
When analyzing the 4-hour chart of SHIBUSDT, it is observed that the price movements continue within a triangle formation. It is considered that if the price falls below the 0.00002226 level, it could retract to around 0.00001865. However, if the price remains above the 0.00002397 level, it is evaluated that it could target the 0.00002775 level.
ORDIUSDT
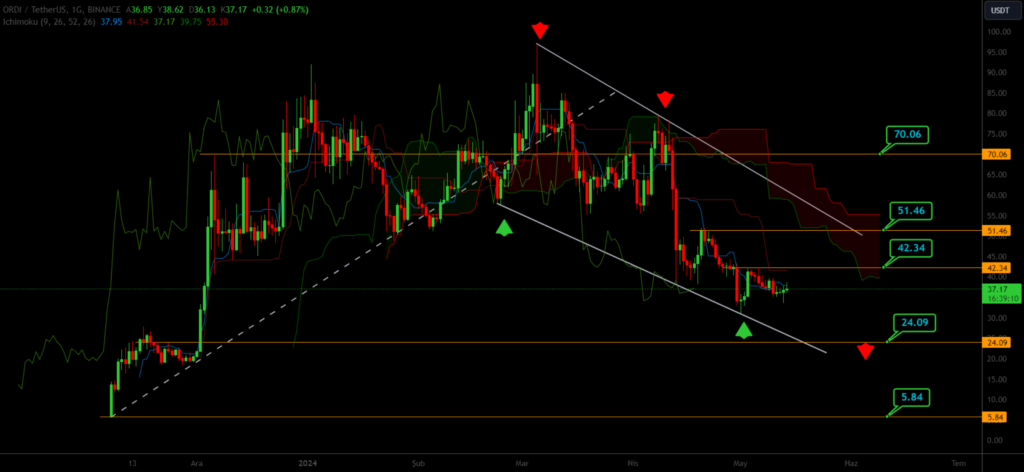
When examining the daily chart of ORDIUSDT, it’s observed that the price movements continue within a downward trend. It is evaluated that if the price falls below the 24.09 level, it could retract to around 5.84. However, if the price remains above the 24.09 level, it is considered that it could target the 42.34 level, and if surpassing that, it may aim for 51.46, ultimately reaching 70.06.