

DOTUSDT
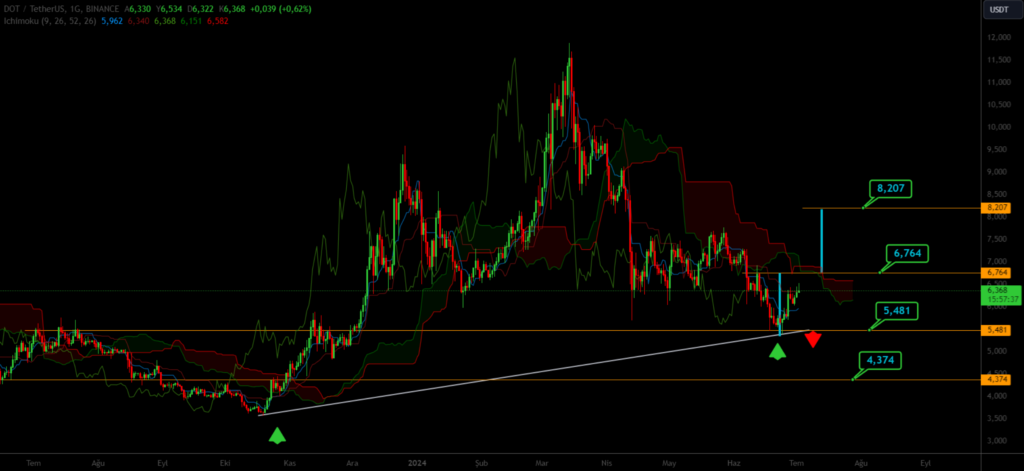
When analyzing the daily chart of DOTUSDT, it is observed that price movements are continuing above a trend line. If the price falls below the level of 5.481, there is a possibility of a retracement towards 4.374. Conversely, if the price remains above 5.481, it could potentially rise to surpass 6.764 and target 8.207.
LINKUSDT
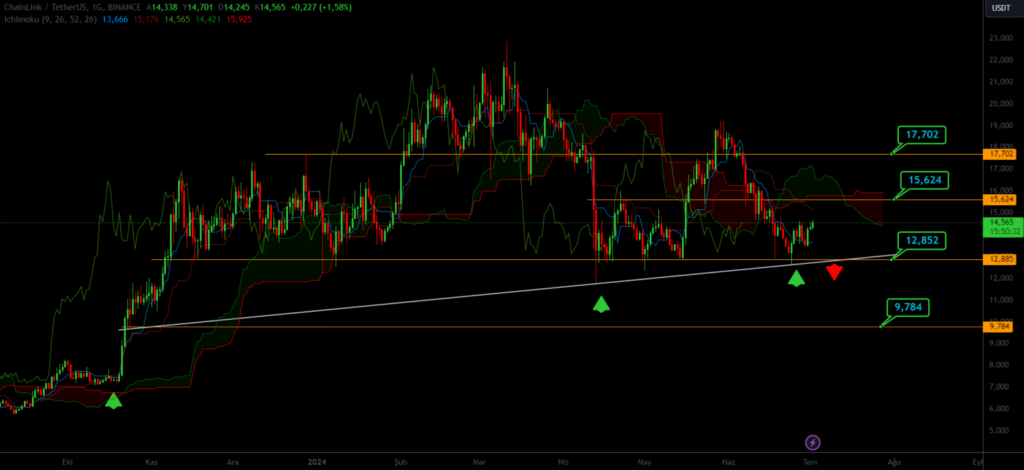
When examining the daily chart of LINKUSDT, it appears that price movements are continuing above the trend line. If the price drops below the level of 12.852, there is a possibility of a decrease towards 9.784. On the other hand, if the price remains above 12.852, it could potentially rise to surpass 15.624 and target 17.702.