

NEARUSDT
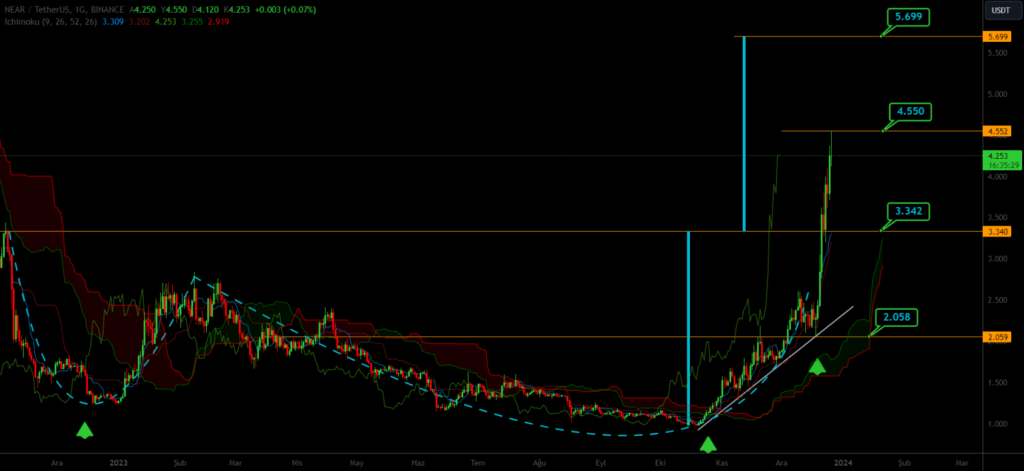
When analyzing the daily chart of NEARUSDT, it’s observed that the price movements continue to form a cup and handle pattern along the trendline. As long as the level of 2.058 is not broken to the downside, it is considered that in movements above the level of 3.342, it could potentially break above 4.550 and target 5.699.
ATOMUSDT
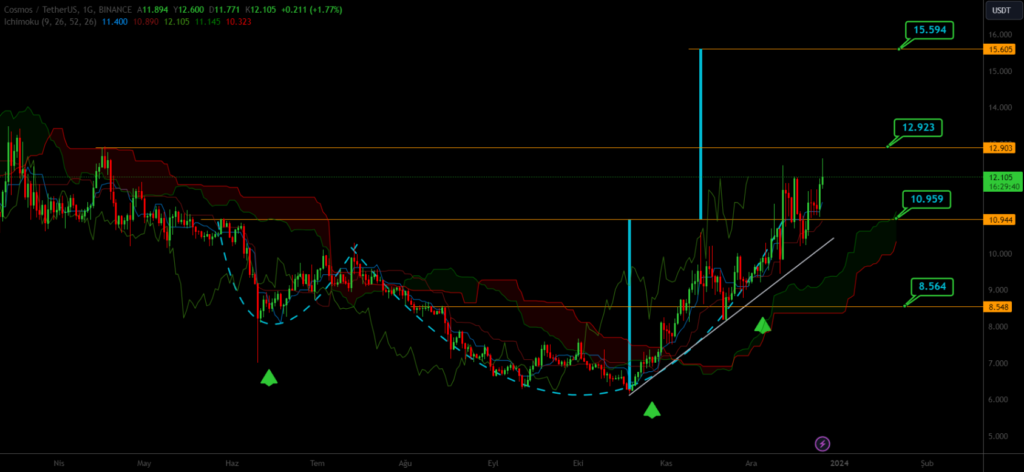
When analyzing the daily chart of ATOMUSDT, it’s observed that the price movements continue to form a cup and handle pattern along the trendline. As long as the level of 8.564 is not broken to the downside, it is considered that in movements above the level of 10.959, it could potentially break above 12.923 and target 15.594.