

LEOUSDT
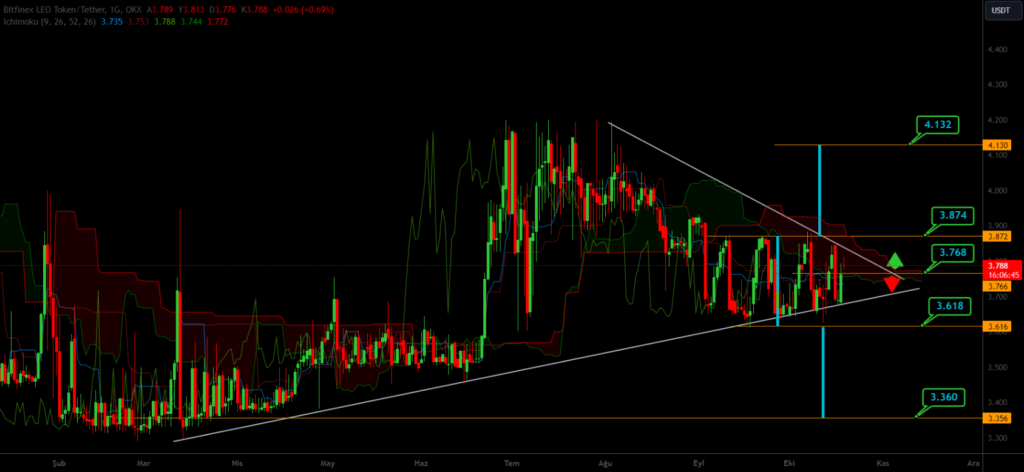
When examining the daily chart of LEOUSDT, it’s evident that price movements are continuing within a triangular pattern. Should the cryptocurrency fall below the 3.768 level, there’s potential for a downward movement that could break 3.618, with a possible decrease to 3.360. However, if the price remains above 3.768, there’s a chance of upward movements, targeting 3.874 and potentially reaching 4.132 once above 3.874.
RNDRUSDT
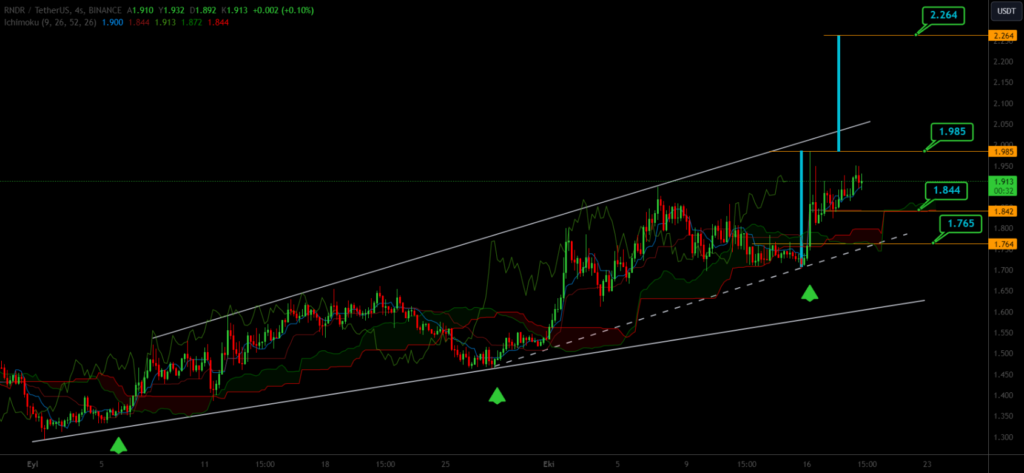
When analyzing the 4-hour chart of RNDRUSDT, it’s apparent that price movements are following an upward trend. As long as the cryptocurrency remains above the 1.765 level, there’s potential for upward movements, with a target of 1.985 once the price crosses above 1.844, and possibly reaching 2.264.