

INJUSDT
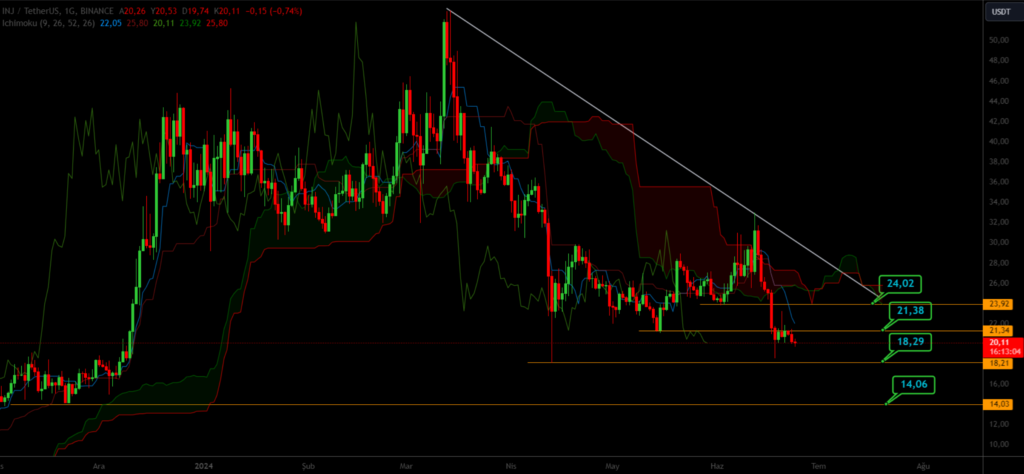
When analyzing the daily chart of INJUSDT, it appears that price movements are continuing below a downward sloping trend line. If INJ fails to surpass the 24.02 level, there is a potential downside towards 21.38. Further decline below this level could lead to a break below 18.29, with a potential lower target around 14.06. Traders should monitor closely whether INJ can break above the 24.02 level to potentially indicate a reversal or if it continues its bearish trend below the mentioned support levels.
BTCUSDT
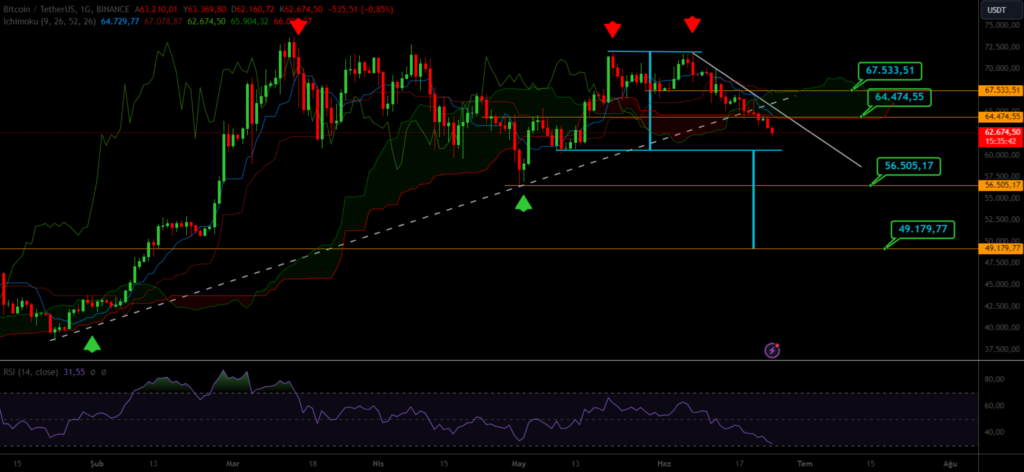
When analyzing the daily chart of BTCUSDT, it appears that price movements have broken below an upward sloping trend line, continuing below a downward sloping trend line. If BTC fails to surpass the 67,534 level, there is a potential downside towards 64,475. Further decline below this level could lead to a break below 56,505, with a potential lower target around 49,180. Traders should closely monitor whether BTC can break above the 67,534 level to potentially indicate a reversal or if it continues its bearish trend below the mentioned support levels.