

LTCUSDT
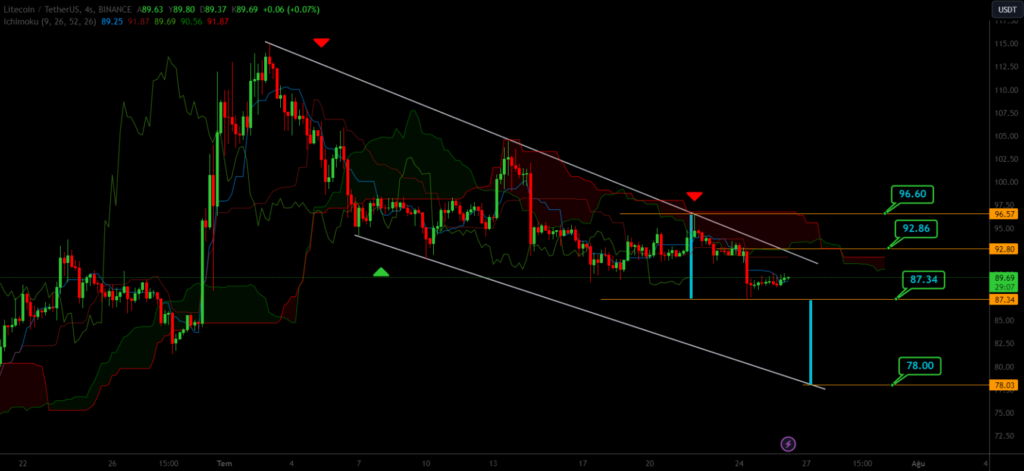
When examining the 4-hour chart of LTCUSDT, it is observed that price movements are continuing within a downward trending pattern. If the cryptocurrency fails to move above the level of 97, there is a possibility of downward movements below 93, with the potential to break below 87 and possibly pull back towards the level of 78.
SOLUSDT
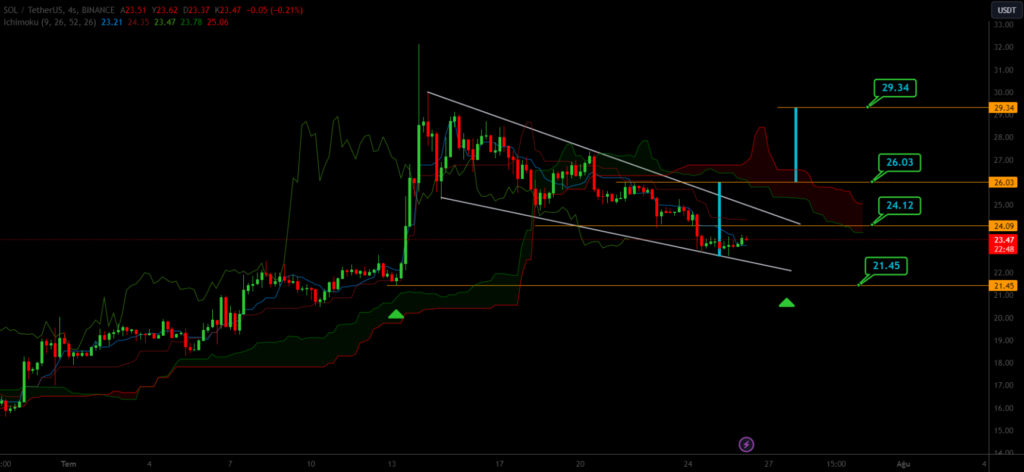
When analyzing the 4-hour chart of SOLUSDT, it is observed that price movements are continuing within a downward sloping wedge pattern. If the cryptocurrency remains above the level of 21.45, there is a possibility of upward movements above 24.12, with the potential to surpass 26.03 and target 29.34.
MATICUSDT
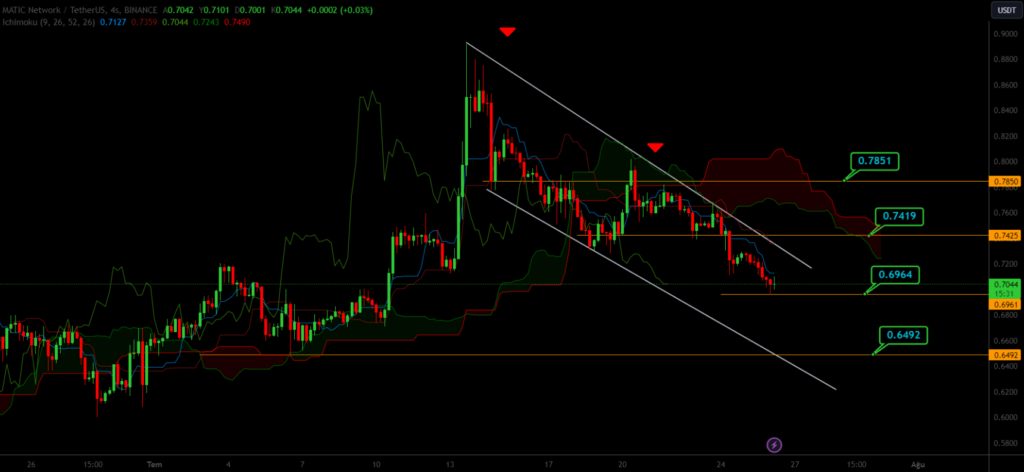
When examining the 4-hour chart of MATICUSDT, it is observed that price movements are continuing within a downward sloping trend. If the cryptocurrency remains below the level of 0.7851, there is a possibility of downward movements towards 0.6964, with the potential to break below 0.7419 and target 0.6492.