

GALAUSDT
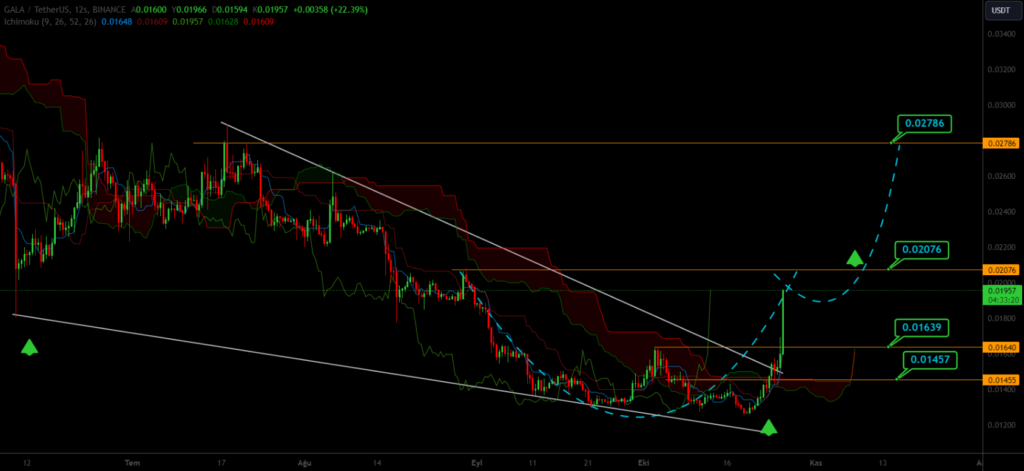
Upon analyzing the 12-hour chart of GALAUSDT, it’s apparent that price movements are persisting within a descending wedge pattern. As long as the cryptocurrency remains above the 0.01457 level, movements above 0.01639 could potentially target 0.02076, and eventually 0.02786.
ARBUSDT
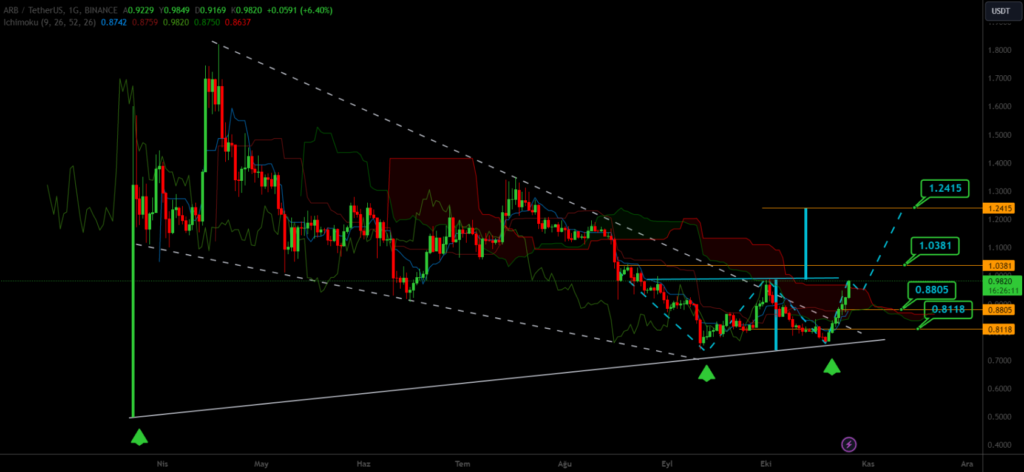
When reviewing the daily chart of ARBUSDT, it is evident that price movements are continuing with the formation of a ‘W’ pattern. As long as the cryptocurrency remains above the 0.8118 level, movements above 0.8805 could potentially aim for 1.0381, and eventually 1.2415.