

FTMUSDT
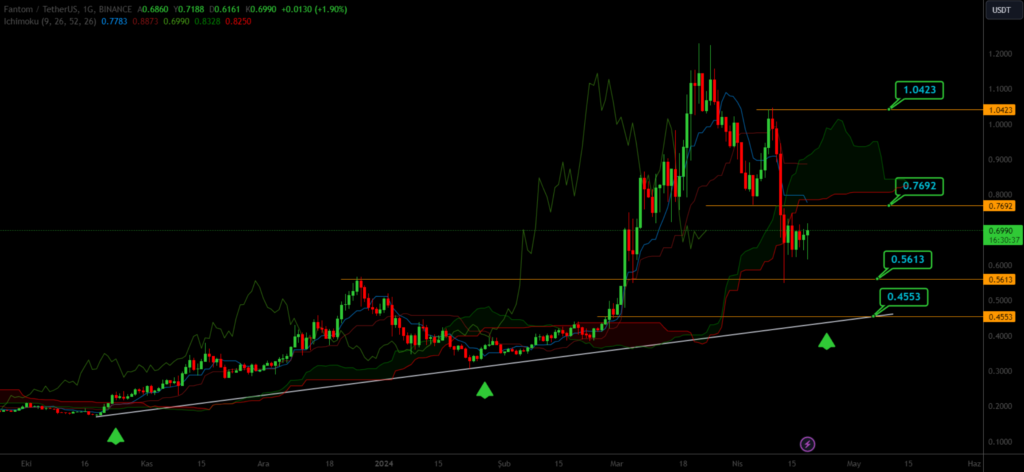
When examining the daily chart of FTMUSDT, it is observed that price movements are continuing within a downward sloping wedge pattern. If the price falls below the 0.4163 level, it could potentially decline to 0.2751, and if that level is broken, further down to 0.1768. However, if the price manages to move above 0.4163, it could target 0.5412, with a further potential target at 0.8115.
TONUSDT
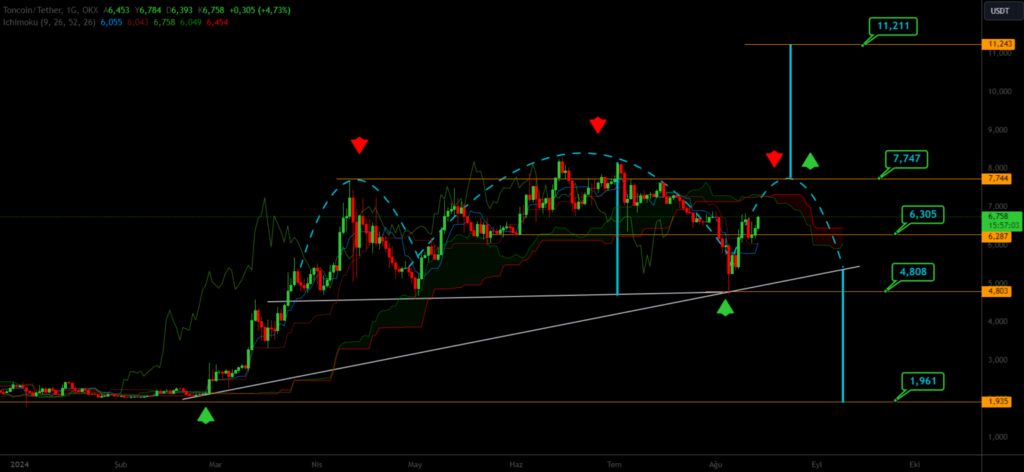
When examining the daily chart of TONUSDT, it is observed that price movements are continuing above the trend line with the formation of a Head and Shoulders (OBO) pattern. If the price surpasses the 7.747 level, it could potentially target 11.211. However, if the price fails to break above 7.747, and drops below 6.305, it could potentially decline further, breaking below 4.808 and possibly retracing as low as 1.961.