Bitcoin Price Prediction As Tether Depegs From $1 – Is BTC in Trouble As Well?

Bitcoin’s price is trading choppy above the $29,000 threshold, and has captured the attention of traders and investors. The current live price of Bitcoin stands at $29,040, with a 24-hour trading volume of $11.3 billion.
As per the recent data, Bitcoin has experienced a nearly 0.50% decline over the past 24 hours. The market is closely monitoring the situation as Tether, the popular stablecoin, undergoes a depegging event from its $1 value.
The impact of this development on Bitcoin is being keenly observed, leading to speculation and discussions about its potential implications for the leading cryptocurrency.
USDT Experiences Slight Depeg and Overweight Situation in Pools
In the tweet, AlΞx Wacy (@wacy_time1) mentions that the cryptocurrency Tether (USDT) is experiencing a slight depeg.
“Depeg” refers to a situation where the value of a stablecoin, like USDT, deviates slightly from its intended peg or fixed value, which is usually $1 USD.
This means that the value of USDT may be fluctuating slightly above or below $1 USD. Additionally, the tweet states that USDT is currently “overweight in pools.”
This likely refers to the supply of USDT in liquidity pools, which are used to provide liquidity for decentralized exchanges (DEXs) and other DeFi protocols.
An “overweight” situation suggests that there is an excess or surplus of USDT in these pools.
We should monitor this situation closely, as the slight deviation and overweight in USDT pools could impact the wider cryptocurrency market and trading activities.
Bitcoin Price Prediction
Bitcoin’s recent market movements were meticulously analyzed using a 4-hour timeframe, revealing a limited trading range.
The cryptocurrency faced resistance around the $30,000 level throughout this period, while finding support at approximately $29,000.
Currently, key technical indicators such as the Relative Strength Index (RSI) and Moving Average Convergence Divergence (MACD) are indicating a bearish trend for Bitcoin.

Reviewing the Bitcoin price chart from Tradingview, it becomes evident that the digital currency has been on a downward trajectory, reaching the $29,100 mark.
This downward trend could potentially persist, leading to further declines in Bitcoin’s price, possibly down to $28,700. However, there remains a possibility that Bitcoin might find support around the $28,700 level during this ongoing descent.
In the event that it breaches this support level, the next targeted level for Bitcoin’s price could be at $28,200.
Top 15 Cryptocurrencies to Watch in 2023
Keep up to date with the most recent initial coin offering (ICO) projects and alternative cryptocurrencies by exploring our hand-picked selection of the top 15 digital assets to monitor in 2023.
This carefully selected list has been put together by industry experts from Industry Talk and Cryptonews, ensuring that you receive professional advice and valuable insights.
Stay ahead of the competition and uncover the potential of these cryptocurrencies as you navigate the constantly changing world of digital assets.
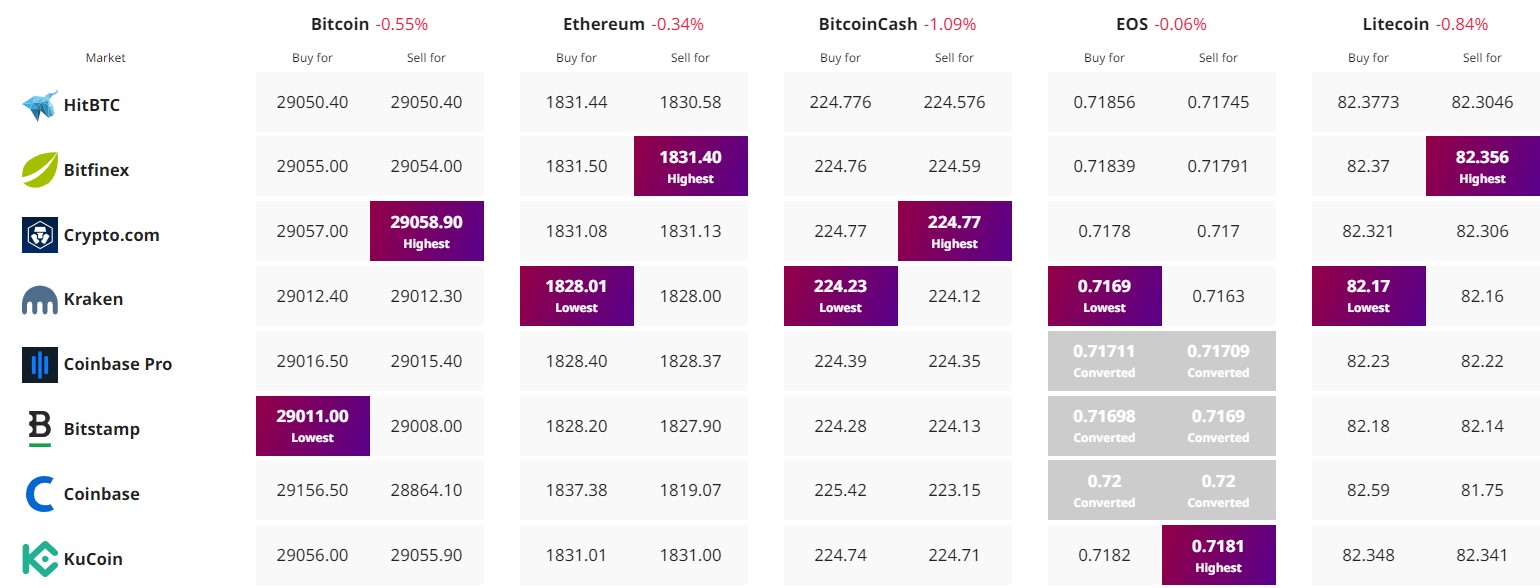
Find The Best Price to Buy/Sell Cryptocurrency

Disclaimer: Cryptocurrency projects endorsed in this article are not the financial advice of the publishing author or publication – cryptocurrencies are highly volatile investments with considerable risk, always do your own research.


