Bitcoin Price Prediction as BTC Faces Crucial $28,500 Threshold – Will it Break Through to Higher Ground?


The cryptocurrency community is abuzz with speculation and anticipation as Bitcoin hovers tantalizingly close to the significant $28,500 mark. Will Bitcoin surge past this barrier to achieve new heights, or is there a retreat on the horizon?
This analysis delves into the current dynamics, technical indicators, and market sentiments to present a comprehensive Bitcoin price prediction.
Bitcoin Price
Bitcoin (BTC/USD) is experiencing intriguing market movements as we approach mid-October. The world’s premier cryptocurrency, as of October 8, is priced at $27,973, representing a modest 0.10% uptick over the last 24 hours.
According to CoinMarketCap, Bitcoin continues to command its first-place position in terms of market capitalization, which currently stands at a whopping $545.69 billion.
In terms of supply data, there’s a circulating supply of approximately 19.51 billion BTC coins, out of a maximum potential supply of 21 billion BTC coins.
Bitcoin Price Prediction
From a technical perspective, especially when viewed in a 4-hour time frame, Bitcoin is nearing several crucial price levels. The current pivot point is set at $27,348.
For traders and investors, it’s essential to watch the immediate resistance level, which sits at $28,350. If this resistance is breached, Bitcoin could aim for the next resistance at $29,400 and potentially $30,785.
Conversely, if bears take control, the cryptocurrency could look at support at $26,630, followed by $25,260, and then a more distant support at $24,556.
Delving deeper into technical indicators, the Relative Strength Index (RSI) is at 48, indicating a near-neutral sentiment. However, with the RSI value being below 50, there’s a slight leaning towards bearish sentiment.
As for the 50-day Exponential Moving Average (EMA), it is currently at $27,500, and as long as the price of Bitcoin stays above this level, the short-term trend could be considered bullish.

The chart patterns further underscore Bitcoin’s potential bullish trajectory. An upward channel has been identified on the 4-hour chart, and importantly, the 50 EMA is acting as a strong support level, especially around the $27,500 mark.
In conclusion, the overall trend for Bitcoin appears to be bullish as long as it remains above the $27,500 mark.
If the current momentum continues and external factors remain favourable, Bitcoin might soon test and potentially breach the crucial $28,500 threshold.
Traders and investors must stay alert, monitor technical levels, and adjust their strategies accordingly.
Top 15 Cryptocurrencies to Watch in 2023
In 2023, you can stay updated on the world of digital assets with our carefully selected collection of the top 15 alternative cryptocurrencies and ICO projects.
Our list is created by experts from Industry Talk and Cryptonews, who provide professional advice and valuable insights for your cryptocurrency investment decisions.
Don’t miss out on this chance to explore the possibilities of these digital assets and stay informed.
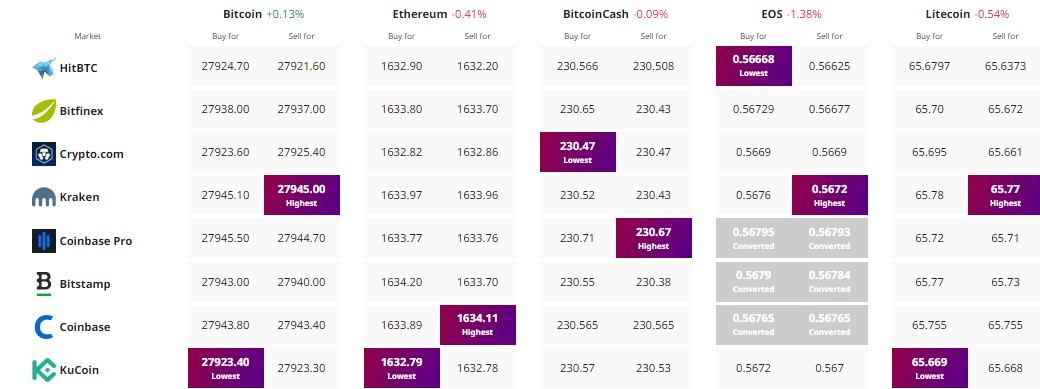
Find The Best Price to Buy/Sell Cryptocurrency

Disclaimer: Cryptocurrency projects endorsed in this article are not the financial advice of the publishing author or publication – cryptocurrencies are highly volatile investments with considerable risk, always do your own research.


