Best Crypto to Buy Now September 25 – Curve DAO Token, Aptos, Axie Infinity

Last week, Pantera Capital, a firm specializing in digital asset investments, identified three major catalysts that could ignite the next wave of growth in the cryptocurrency market in its blog post.
Portfolio manager Cosmo Jiang outlined these factors, which include the potential approval of spot Bitcoin ETFs, improving regulatory conditions, and advancements in blockchain scaling capabilities.
Jiang highlighted that BlackRock’s application for a Bitcoin ETF is particularly important. As the world’s largest asset manager, BlackRock’s move indicates a calculated decision to invest further in the digital assets sector, despite ongoing regulatory uncertainties.
The blog post suggested that BlackRock’s application could be a precursor to similar filings from other asset management giants like Fidelity, especially following a U.S. appeals court ruling that favored Grayscale in a lawsuit against the SEC’s previous denial of their Bitcoin ETF application.
On the regulatory front, Jiang pointed to two key lawsuit victories against the U.S. Securities and Exchange Commission (SEC) by Ripple, a payments firm, and Grayscale, a digital asset manager.
The third catalyst, according to Jiang, is the rapid development of blockchain scaling solutions, specifically Ethereum layer-2s like Arbitrum and Optimism. These advancements are improving transaction speeds and reducing costs, opening up new possibilities for blockchain applications.
As the cryptocurrency market experiences these emerging trends, investors are keenly watching for signals on the best crypto to buy now.
While Bitcoin’s price has stabilized above its 20-day exponential moving average, trading at $26,289 today, other cryptocurrencies such as Curve DAO Token, Wall Street Memes, Aptos, Meme Kombat, and Axie Infinity are also vying for attention as the best crypto to invest in, backed by strong fundamentals and/or positive technical analyses.
Is Curve DAO Token (CRV) the Best Crypto to Invest in?

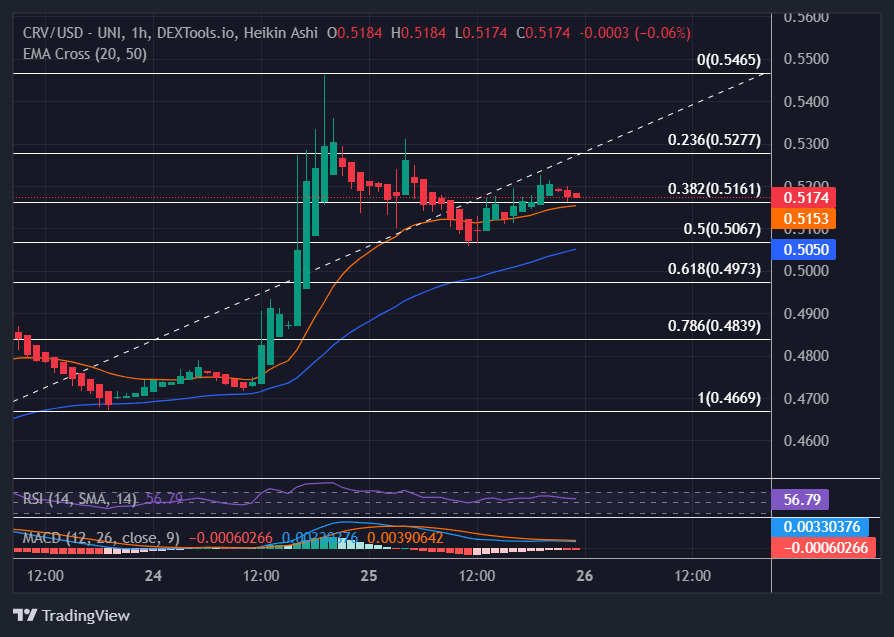
The 20-day EMA for the CRV currently stands at $0.5153, above the 50-day EMA at $0.5050. This is usually a bullish sign, as a higher short-term EMA compared to the long-term EMA often suggests an upward price momentum.
Nevertheless, given the marginal price increase of 0.28% to $0.5187 today, traders and investors should be cautious. The narrow gap between the 20-day and 50-day EMAs, along with modest price changes, indicates volatility and uncertainty around CRV’s future price action.
The RSI for today is 56.79, a substantial decline from yesterday’s RSI of 71.28. While yesterday’s RSI was in the overbought territory, today’s lower RSI suggests a cooling off period and points towards a more balanced market situation.
The MACD histogram has shifted from a positive 0.00298863 yesterday to a negative -0.00060266 today. This transition from positive to negative values highlights a growing bearish momentum, potentially affecting CRV’s near-term price.
Analysis of Volume, Market Cap, and Key Price Levels
The 24-hour trading volume has seen a significant decrease of 56.52% to $56,588,051, currently ranking #41 on CoinMarketCap. The reduced volume could be a sign of waning investor interest in CRV, which may result in lower price volatility in the short term.
CRV is currently facing a resistance at the Fibonacci level of $0.5277. Overcoming this resistance could signal a continuation of an upward trend. On the downside, immediate support exists at $0.5161, also coinciding with the 20-Day EMA. Holding above this level could provide a base for the asset to bounce back.
CRV’s technical indicators are somewhat mixed. While the 20-Day EMA being higher than the 50-Day EMA is a positive sign, the declining RSI and the shift in MACD from positive to negative show contrasting trends.
Investors should trade cautiously, observing how the asset behaves at the identified support and resistance levels. A break below the $0.5161 support level or a breakthrough above the $0.5277 resistance level could set the next trend for CRV.
Unprecedented Funds Raised in Wall Street Memes’ Meme Coin ICO
Wall Street Memes is set to close its Initial Coin Offering (ICO) for its meme coin soon, with nearly $30 million already committed by investors.
The last 48 hours saw an infusion of more than $2 million, heightening anticipation for the project’s launch. Compared to Dogecoin’s initial market cap of $2.1 million, Wall Street Memes has amassed a sum that dwarfs it by tenfold.
Ethereum Presale Attracts Hefty Volume, Big Exchanges Take Notice
Within the past 24 hours, 4,700 transactions were made to purchase $WSM through the Ethereum presale smart contract, as confirmed by team sources. With the presale price $0.0337, this meme coin has attracted attention not just from individual investors but also from major trading platforms.
According to the Wall Street Memes team, the coin is set to be listed on several high-tier exchanges within a day.
Wall Street Memes doesn’t just hold the title for the largest meme coin ICO–it also boasts a community that is larger than most. Across various social media platforms, the project attracted over a million followers.
For context, it took Dogecoin, arguably the most successful meme coin, a decade to acquire three million followers. Community engagement is pivotal for the success of any meme coin, and Wall Street Memes appears to have a head start in this department. Daily tweets from the project receive tens of thousands of views and substantial interaction, solidifying its place in the crypto investment landscape.
Elon Musk’s Involvement: A Billion-Dollar Implication
The impact of having a personality like Elon Musk engage with Wall Street Memes’ social media posts can’t be overstated. Well-known for his interest in cryptocurrencies and particularly in Dogecoin, Musk’s interactions with the project’s posts could have significant implications for the meme coin.
Earlier this year, a single tweet from Musk led to the creation of the Miladys Meme Coin, which gained a market cap of over $111 million in short order. While there’s no direct evidence linking Musk to Wall Street Memes, the timing of large purchases of $WSM tokens by an unknown wallet does raise questions.
Sources indicate that on August 1, an unidentified wallet made five consecutive purchases of $WSM, amounting to 460 ETH or approximately $840,000 at that time. This follows another purchase of 93 ETH worth of $WSM by the same wallet two weeks prior, totaling an investment of $1 million in the meme coin.
The transactions can be verified on Etherscan. Given the significance of such large crypto investments and the upcoming listing of the Wall Street Memes coin on high-tier exchanges, it is clear that the project has reached a critical juncture in its development.
Visit Wall Street Memes Here
Aptos (APT) Navigates Key Levels as Momentum Builds: Is It the Best Crypto to Buy Now?

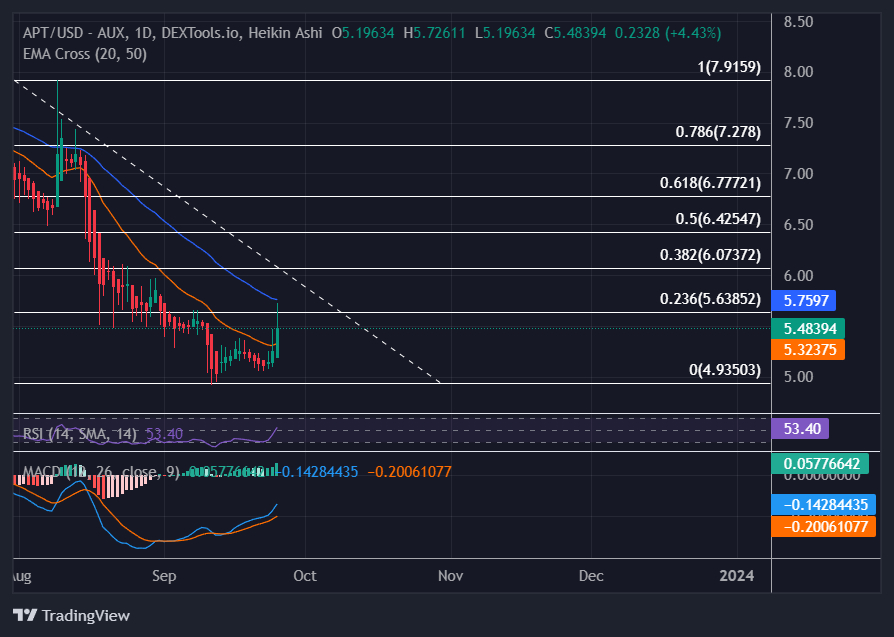
The 20-day EMA for APT stands at $5.3237, which is below the 50-day EMA of $5.7596. Usually, when the short-term EMA is lower than the long-term EMA, it can be a bearish sign. However, the current price of $5.5915 is above the 20-day EMA and is closing in on the 50-day EMA, suggesting a potential trend reversal from bearish to bullish.
The RSI has seen a considerable uptick, moving from 41.35 yesterday to 53.38 today. This increase indicates a shift towards a more bullish momentum and is a sign that the coin may have more room for upward movement before hitting overbought conditions.
Today’s MACD histogram is at 0.05773857, which is an increase from yesterday’s 0.03031440. The growing positive value is indicative of a bullish sentiment gaining strength, which could further propel the APT price upwards.
Analysis of Volume, Market Cap, and Key Price Levels:
The 24-hour trading volume for Aptos has risen by 18.69% to $350,532,521, securing it the #10 rank on CoinMarketCap. The increased volume indicates a surge in trading activity and investor interest, potentially contributing to future volatility.
In terms of resistance, the APT coin was rejected at the 50-day EMA level, which also coincides with a Fibonacci resistance level of $5.6385. Breaking past this resistance would be a strong bullish indicator.
Conversely, immediate support is found at the Fibonacci level of $4.9350. Additionally, the coin is about to close a candle above its 20-day EMA, further strengthening this support level. The next significant support is way down at $3.1, indicating a potential for steep declines if the immediate support levels are breached.
Aptos is currently in a critical phase, with its price hovering near key resistance and support levels. The indicators suggest a mixed but increasingly bullish sentiment, supported by the rising RSI and MACD histogram. Closing a candle above the 20-day EMA can provide a bullish confirmation.
For traders and investors, it would be wise to watch for a decisive break above the $5.6385 resistance or below the $4.9350 support, as this could set the direction for the next trend. Given the considerable trading volume and shifting momentum indicators, there is potential for significant price movements in the near future.
The technical analysis for APT indicates a coin on the cusp of a potential bullish trend reversal, backed by a rise in RSI and MACD, as well as growing trading volume. The coin has key resistance and support levels that need to be closely monitored. Investors are advised to trade cautiously within these defined levels and look for confirmatory signals before making substantial moves.
Meme Kombat: Bridging Memes and Combat Gaming in the Meme Coin Market
Meme Kombat, a recently introduced token, integrates memes and combat gaming, promising both active and passive income streams for its participants. The token is currently offerimg an APY of 112% on staking.
According to the project’s whitepaper, the Meme Kombat Token ($MK) serves as the central asset in the financial ecosystem.
The Role of Staking in Meme Kombat
Staking is a core feature in the Meme Kombat ecosystem, offering a form of crypto investment that yields a passive income via APY. Users can link their crypto wallets securely to the platform’s website to stake their $MK tokens.
30% of the total token supply is earmarked specifically for staking and in-game rewards. This allocation encourages users to hold onto their tokens, providing a measure of stability.
Once staked, there’s a 14-day lock-in period. After that, users have the option to either withdraw their tokens or keep them staked to continue earning the stated APY.
Betting Systems and Crypto Presale Insights
Another financial aspect of Meme Kombat revolves around its various betting mechanisms. These include Player-vs-Player and Player-vs-Game options, offering a diversified approach to crypto investment.
Additionally, the crypto presale for the platform is ongoing and has already seen over $60,000 raised in less than a day. The presale hard cap is set at $10 million, with each token priced at $1.667. Early buyers in the crypto presale have the added advantage of automatic staking.
Scheduled to launch its various features in October or November 2023, the platform also plans to roll out Meme Kombat Season 1 to sustain user engagement. By December 2023, Meme Kombat 2 is expected to be released with enhanced gameplay features.
Visit Meme Kombat Here
Analyzing Axie Infinity’s Mixed Signals: The Search for the Best Crypto to Buy Now

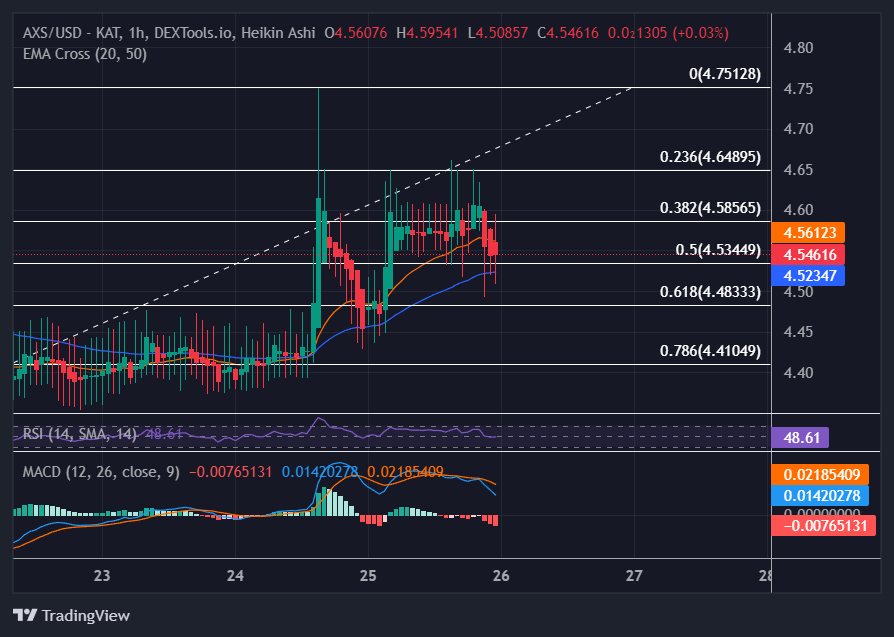
AXS is showing a slight bullish momentum with a current price of $4.5267, up by 5.71% from its previous close. The coin also marked a peak at $4.6613 and a low at $4.7505 today.
With the 20-day EMA at $4.5321 and the 50-day EMA at $4.8498, AXS is trading just above its short term moving average. Typically this close convergence between the 20-day and 50-day EMA points to building volatility and uncertainty ahead for the AXS price.
The RSI for today is at 46.45, showing a small increase from yesterday’s 43.72. Though the RSI is still under 50, it is not close to the oversold territory (below 30), signifying a somewhat balanced market sentiment.
In terms of the MACD Histogram, it stands at 0.03250787, a slight increase from yesterday’s 0.02966455. This incremental rise suggests that bullish sentiment may be gathering steam.
Market Volume and Price Levels to Watch
The trading volume for AXS has dropped by 22.77% to $54,331,043, but it still holds a respectable #43 rank on CoinMarketCap. The decrease in volume may indicate waning investor interest or a potential consolidation phase.
AXS is currently wrestling with multiple resistance levels at the Fibonacci level of 4.5344 and the 20-Day EMA. It recently got rejected at the Fibonacci 0.236 level of 4.6489 and faced a similar fate at the Fibonacci 0 level of 4.7512 yesterday.
On the flip side, immediate support can be found at the Fibonacci level of 4.4109 and the trend line at 4.3935. Should AXS slip below these, the next support zone is at 4.31, serving as a line of defense against a more significant downtrend.
What Could be Next for AXS?
Given the mixed indicators, AXS seems to be in a state of flux. The RSI suggests a slight bullish momentum, but the MACD’s incremental rise and the dropping volume indicate that the market is far from decided.
Investors might consider maintaining a watchful eye for now. A drop below the $4.31 support or a break above the fibonacci 0.236 resistance at $4.6489 could signal a more definitive trend. Trading within well-defined risk parameters is advisable at this juncture.
Disclaimer: Crypto is a high-risk asset class. This article is provided for informational purposes and does not constitute investment advice. You could lose all of your capital.


