Best Crypto to Buy Now September 18 – Chainlink, ApeCoin, Optimism

Anticipation of a pause in interest rate hikes, spurred by the upcoming Federal Open Market Committee (FOMC) meeting on September 20, stimulated a marked increase in Bitcoin prices earlier today.
Bitcoin rose over 3.4% to hit a September high above $27,400 after a stagnant weekend where it held the key $26,000 support level.
Some analysts argue Bitcoin’s ability to hold crucial support makes it the best crypto to buy now ahead of the pivotal FOMC decision.
Many investors are betting on a freeze to interest rate increases at the FOMC meeting later this month. This expectation has been driven by the latest Consumer Price Index (CPI) report showing inflation somewhat slowing in August. Specifically, the annual core CPI rate that excludes food and energy fell to 4.3% from 4.5% in July.
With inflation potentially nearing the Fed’s 2% target, markets strongly believe rates could be paused. CME Group’s interest rate probabilities echo this, forecasting a high chance of no hike. This has boosted hopes for a recovery in crypto markets, with Bitcoin looking primed as the best crypto to buy now.
While the price bounce is positive, risks still remain. Tighter regulations and recent crypto market turmoil continue weighing on investor sentiment.
However, Bitcoin’s ability to defend the $26,000 support zone keeps trader optimism intact. Experts see upside potential if Bitcoin holds this critical level headed into the Fed’s rate decision.
Despite trimming its gains from earlier highs, Bitcoin is still nursing a 0.77% increase so far today, changing hands near $26,743 as of writing.
Following Bitcoin’s lead, other cryptos like Chainlink, Wall Street Memes, Apecoin, Bitcoin BSC, and Optimism are also on the rise. With their promising utility and favorable technical outlooks, they are strong candidates for the best crypto to buy now.
Chainlink (LINK) Price Seeks to Surpass EMAs for Continued Upside

After a month of range-bound trading, Chainlink (LINK) is showing signs of life.
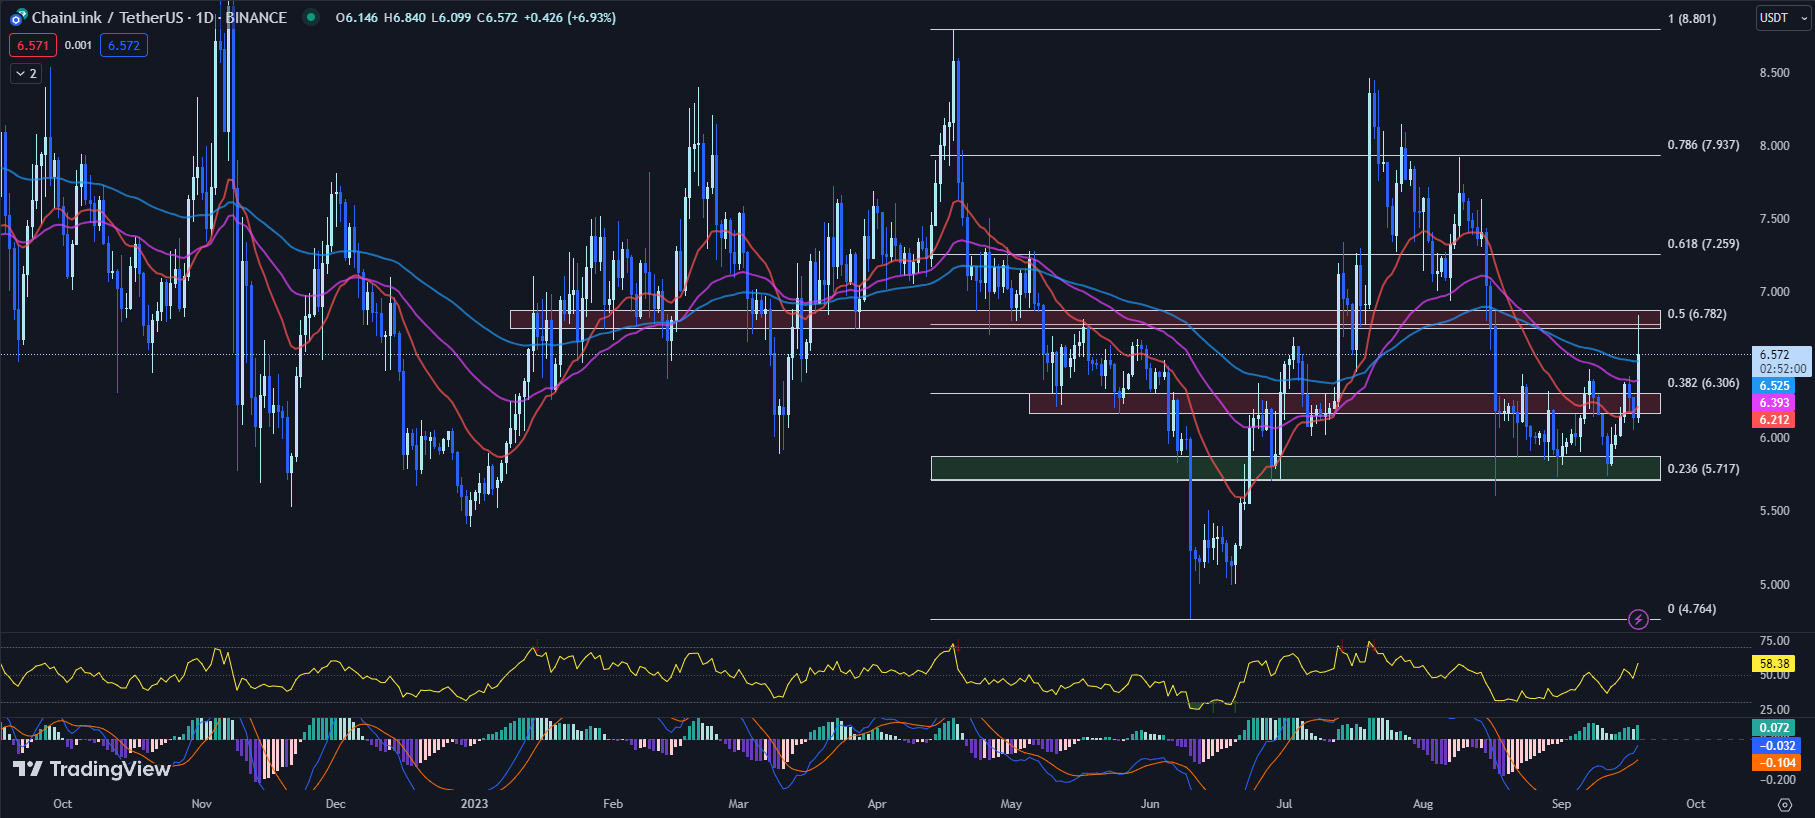
Key technical indicators suggest growing bullish momentum following LINK’s breakout above the Fib 0.382 resistance of $6.306.
This level had confined LINK for weeks until today’s surge to an intraday high of $6.840. LINK now trades at $6.572, up 6.93% as it seeks to extend its uptrend.
A key aspect of the current LINK price action is the battle to secure a position above the 50-day and 100-day EMAs of $6.393 and $6.525 respectively.
These EMAs often act as dynamic support and resistance levels, and a sustained move above these averages could signal a continuation of the uptrend.
The 20-day EMA, currently at $6.212, has also shown its significance. The LINK price staying above this level may indicate that the short-term sentiment in the market is bullish.
LINK’s RSI has risen to 58.38 from yesterday’s 47.48. This rise in the RSI suggests growing bullish momentum and the potential for continued price gains.
Meanwhile, the MACD histogram has increased to 0.072 from 0.051, indicating that the bullish momentum is indeed accelerating.
Notably, LINK’s market cap has witnessed an impressive 8.22% increase to $3.67 billion, while the 24-hour volume has surged by a whopping 271.02% to $337.7 million.
This significant increase in trading volume supports the bullish case for the LINK price, as it is often associated with a strong price move.
In terms of resistance, the LINK price faces a significant challenge in the horizontal resistance zone of $6.752 to $6.874, which aligns with the Fib 0.5 level of $6.782.
This level was retested earlier today when LINK marked its intraday high of $6.840. Overcoming this resistance could open the doors to further upside.
On the downside, immediate support is found in the horizontal resistance-turned-support zone of $6.167 to $6.307. This zone coincides with the Fib 0.382 level of $6.306. It will be crucial for the LINK price to remain above this level to maintain the bullish momentum.
The recent LINK price action and technical indicators suggest a bullish shift in the market sentiment. Investors and traders should monitor these key levels closely, as they could provide important signals about the future direction of the LINK price.
Stake and Hold: Wall Street Memes’ 58% APY Rewards Program; Best Crypto to Buy Now?
Wall Street Memes ($WSM) hopes to lead retail investors in a defiant stand against Wall Street’s elites, channeling the GameStop short squeeze energy.
But its presale ends in less than 7 days, giving retail investors little time left to get involved. The project has already raised over $25 million as it courts the meme coin crowd.
Wall Street Memes’ major crypto exchange listings are just around the corner.
There’s a lot of speculation about which high-ranking exchanges will be the first to list $WSM, with Binance rumored to be in the running. However, nothing is yet confirmed.
The project’s native $WSM token currently sells for $0.0337 in its presale. Some analysts tout Wall Street Memes as one of the best crypto to buy now before the listings potentially send its value soaring.
Wall Street Memes emerged from an online community of over 1 million members who rallied around disrupting the old guard of Wall Street.
The project’s founders have pedigree in this arena, having previously launched an NFT collection called Wall Street Bulls that sold out in just 32 minutes.
In addition to exchange listings, Wall Street Memes has rolled out a 58% APY staking rewards program. Early data shows that 34.5% of the total token supply has already been staked.
This staking activity could limit selling pressure when Wall Street Memes debuts publicly.
The project allocates a substantial 50% of the total token supply to marketing efforts and 30% to community rewards. This demonstrates Wall Street Memes’ ambitions extend beyond being just another meme coin.
Wall Street Memes also enjoys support from high-profile figures like Elon Musk, who has interacted with the community’s social media channels in the past.
With major exchange listings imminent and staking rewards already proving popular, Wall Street Memes is making a case as one of the best crypto presale opportunities right now for investors who get in before the presale countdown hits zero.
Visit Wall Street Memes Now
APE Crypto: Is the Bottom Finally In?

Following a month of bearish activity, ApeCoin (APE) demonstrates signs of a potential reversal.
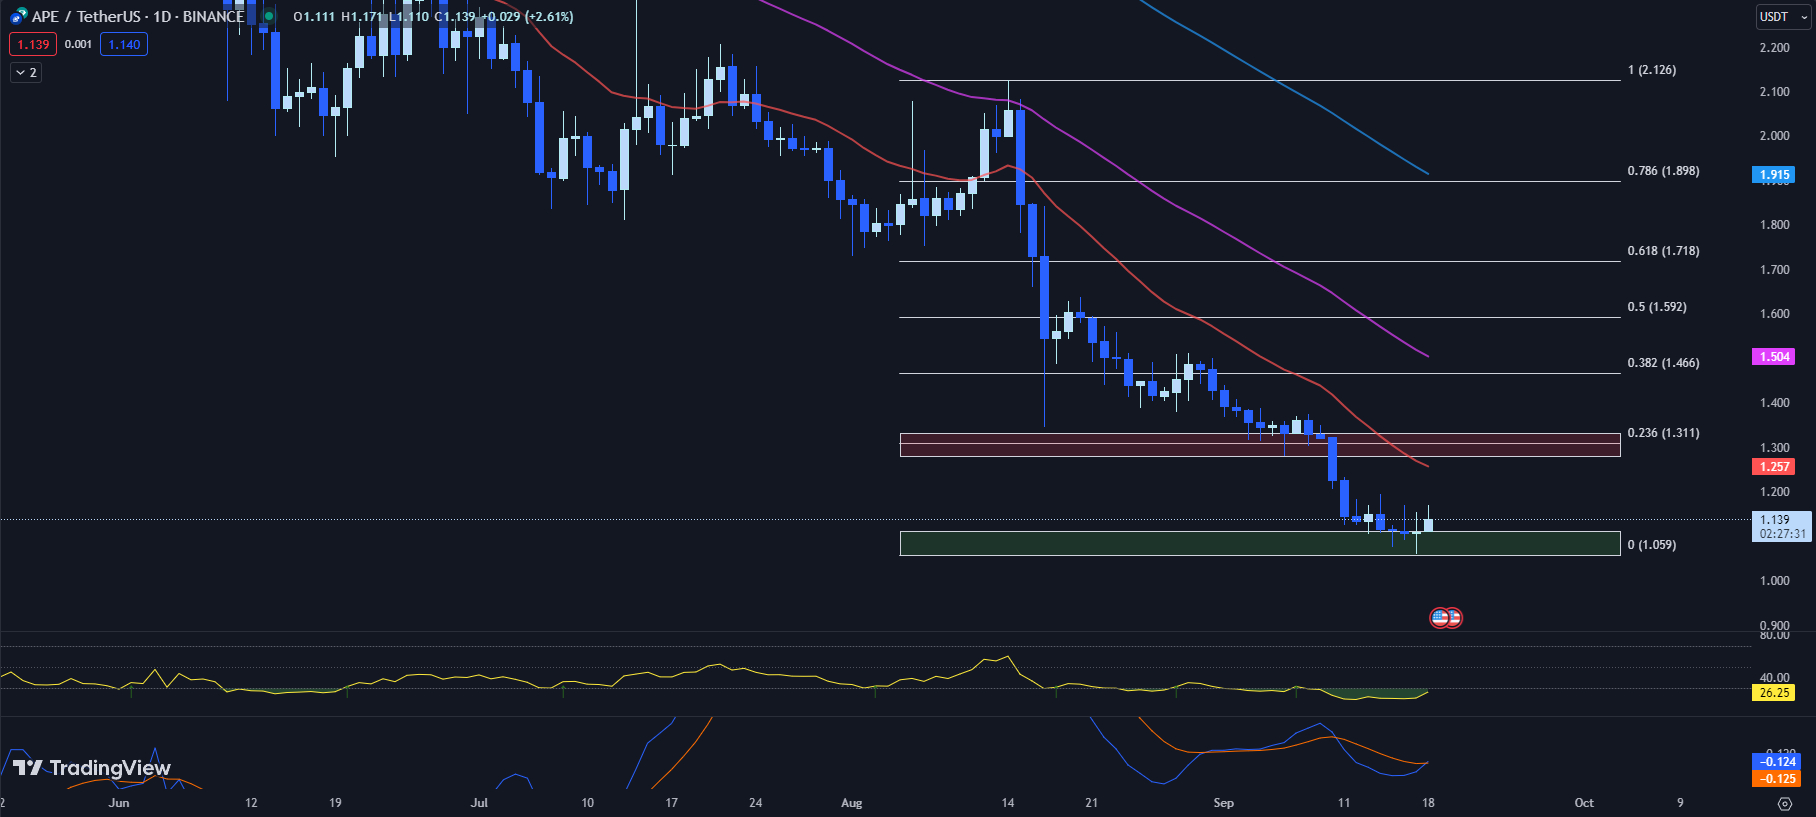
APE price has seen a significant decline over recent weeks, reaching a new all-time low of $1.059 just yesterday. However, with the RSI persistently in oversold territory for the past month, and the MACD indicating a bullish crossover, an optimistic picture is emerging.
Today’s bullish price action further reinforces the question: has APE finally bottomed out?
APE’s RSI has risen to 26.25 from yesterday’s 20.55. This indicator has remained in oversold levels for the majority of the past month, suggesting that APE might be undervalued and setting the stage for a potential price increase.
Deepening this positive anticipation, the MACD histogram has moved upwards to 0.001 from yesterday’s -0.004, suggesting a bullish crossover.
This transition could possibly be the precursor to an uptrend, marking APE’s worthiness to be considered the best crypto to buy now.
The APE price has already begun to react to these bullish signs. The cryptocurrency’s current price is $1.139, up by 2.61% so far today.
This upward price movement is accompanied by a 3.50% increase in market cap to $419.9 million, and a 7.76% rise in 24-hour volume to $75.7 million, further testifying to the growing investor interest in APE.
However, the APE price faces immediate resistance at the 20-day EMA of $1.257, closely followed by a horizontal resistance zone of $1.280 to $1.333. This zone coincides with the Fib 0.236 level of $1.311, a potential reversal point in a retracement.
On the downside, the swing low support zone of $1.059 to $1.111 provides immediate support. This zone is critical to watch, as a break below could signal further bearish activity pushing the APE price into the price discovery zone on the downside.
While recent price action suggests the potential for an upward move, traders should carefully monitor these critical support and resistance levels.
The convergence of the oversold RSI and bullish MACD crossover presents a strong case for the APE price to continue its upward journey.
However, a firm break above the immediate resistance is necessary for sustainable bullish momentum.
Crypto Gems Unveiled: Bitcoin BSC Takes the Lead as the Best Crypto to Buy Now
With its presale raising nearly $3 million so far, Bitcoin BSC is generating buzz as a faster Bitcoin replica on the Binance Smart Chain.
Unlike the resource-intensive mining used by Bitcoin, Bitcoin BSC utilizes a proof-of-staked authority model that allows token holders to earn additional tokens simply by staking their holdings.
For those who missed the early Bitcoin train, this token offers another chance to invest.
Bitcoin BSC is not just another token; it’s designed to be similar to Bitcoin in its early days. It’s priced at $0.99 per token during its presale, with a soft cap of 4 million tokens.
After buying the tokens, investors can activate staking with a simple click. Rewards are given out every time a new block is confirmed on the Bitcoin blockchain, which usually happens every 10 minutes.
Following Bitcoin’s tradition, these rewards will halve every four years, ensuring a planned 120-year rollout until all 21 million tokens are fully distributed.
The presale price is set at $0.99 per token until the hard cap of $6 million is reached. There are already plans for listings on crypto exchanges after the presale ends.
Pantera Capital suggests that by the 2024 halving event, Bitcoin could reach $148,000. While this prediction is for Bitcoin, it could have an indirect impact on Bitcoin BSC.
Bitcoin BSC offers an interesting mix of old and new. It brings back the nostalgia of early Bitcoin while adding modern features like staking. For those looking for the best crypto to buy now, Bitcoin BSC might be worth keeping an eye on.
Visit Bitcoin BSC Now
Optimism (OP) Price Consolidates Around Key Support Level: What’s Next?

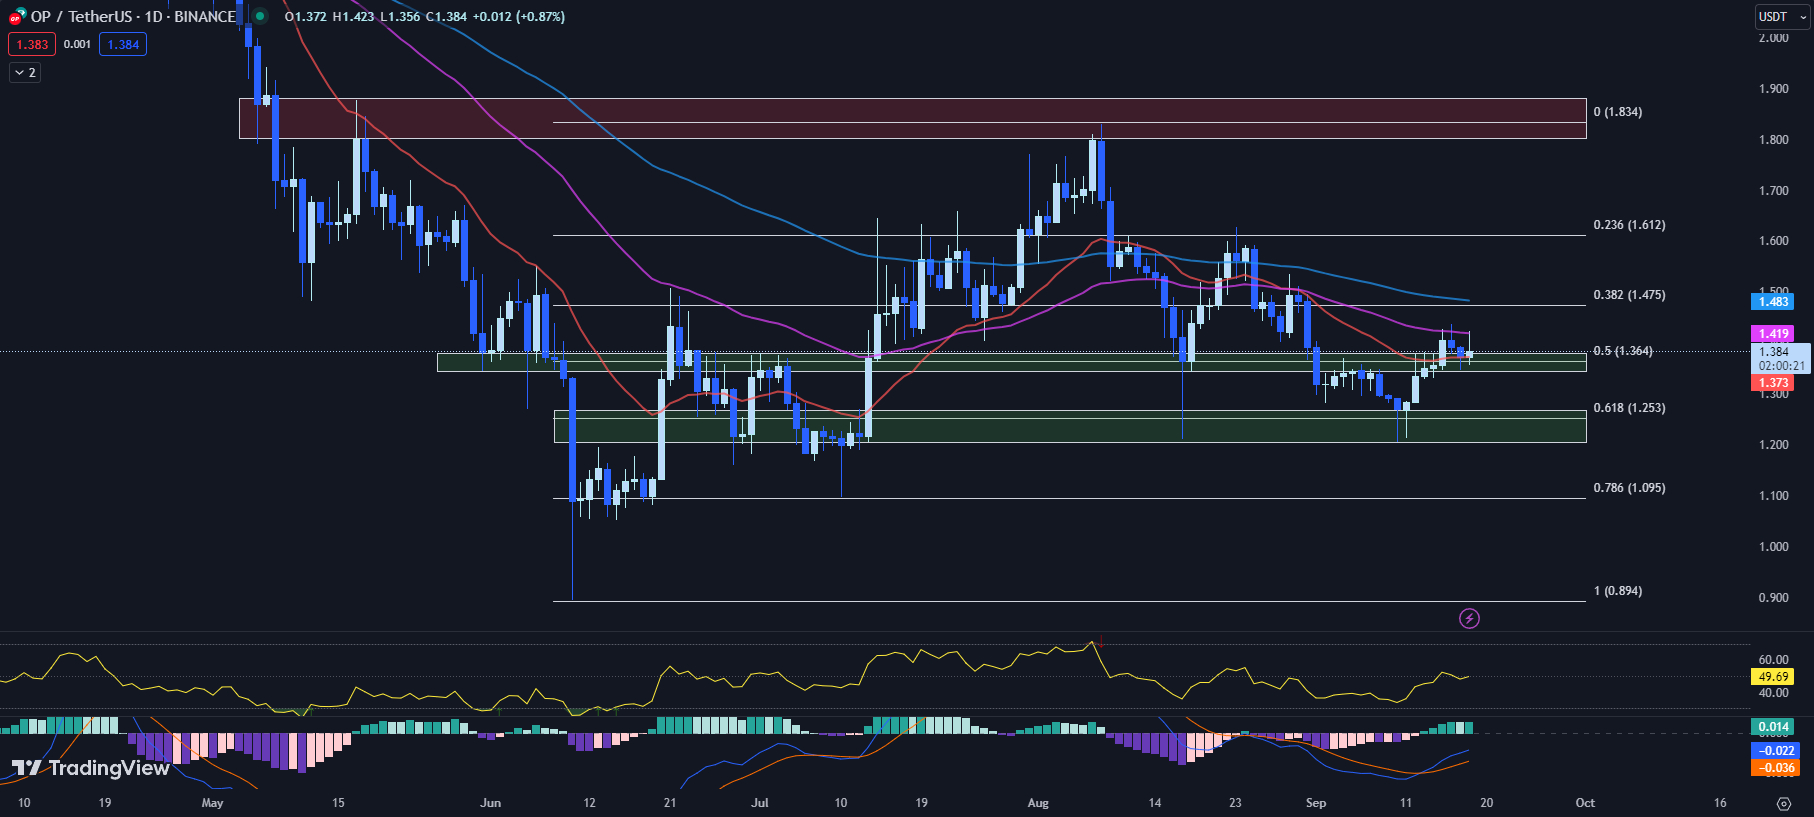
Following an impressive 8% uptick last week, Optimism (OP) has seemingly taken a breather over the weekend, retracing its steps to its previous resistance zone of $1.346 to $1.380.
Now, this level has been confirmed as new support, as OP trades comfortably above it.
OP’s 20-day EMA is currently standing at $1.373, offering immediate support for the OP price. This is a positive signal, as it suggests that the recent upward momentum is still in play.
The area between $1.346 and $1.380 serves as a horizontal support zone which also aligns with the Fib 0.5 level of $1.364 and the 20-day EMA.
This confluence of support levels tends to reinforce the strength of the support, making it a significant level for traders to watch.
OP’s RSI has inched up to 49.69 from yesterday’s 48.04. This movement toward the 50 level indicates that the OP price could be transitioning from a bearish to a bullish market.
However, traders should tread carefully as this level is often seen as a tipping point, and the price could easily swing in either direction.
The MACD histogram remains flat at 0.014, suggesting that the momentum is relatively neutral at this stage.
This could mean that the OP price is likely to continue its current consolidation phase for a little while longer before a decisive move is made.
Resistance for the OP price lies at the 50-day EMA of $1.419. If the price successfully breaks this level, the next resistance is at the Fib 0.382 level of $1.475, followed by the 100-day EMA of $1.483.
These levels represent potential targets for bullish traders and potential reversal points for those with a more bearish outlook.
Given the current technical indicators, traders should watch for a sustained break above the 50-day EMA to confirm the bullish trend.
Conversely, a break below the 20-day EMA might indicate a potential shift in the trend.
Regardless of the outcome, active monitoring of these key levels and indicators will be critical in the coming days as the OP price continues to make its moves.
Disclaimer: Crypto is a high-risk asset class. This article is provided for informational purposes and does not constitute investment advice. You could lose all of your capital.


