Best Crypto to Buy Now August 28 – THORChain, dYdX, Bitcoin SV

Since reaching a high of nearly $69,000 in November 2021, Bitcoin has experienced a massive price drop, marking the cryptocurrency’s most prolonged bear market so far.
The world’s largest cryptocurrency by market cap has remained in a bearish state for almost 490 days, a fact emphasized by Michaël van de Poppe in a post on the platform X, previously known as Twitter.
Given Bitcoin’s ongoing consolidation and uncertain path, what are the best cryptos to buy now?
Today, the price of Bitcoin is down by more than 50% from its historical high, underscoring the volatility and hardships the cryptocurrency sector has experienced in recent times.
Poppe made comparisons between the present market conditions and those of 2015, which also saw a period of stability, even as confidence in cryptocurrencies waned, though the sector displayed consistent fundamental growth.
Poppe also shared thoughts for those who are navigating their first intense bear market. He mentioned that these tough times present a learning curve for investors.
“And just because it hurts, you’ll learn. You’ll keep moving forward and you’ll identify new opportunities and experiences you’ll be using later in the cycle or the next cycle,” Poppe observed.
Several recent events could have served as positive indicators for Bitcoin’s value, yet they seem to have minimal impact on its current price.
For instance, global governments and traditional institutional investors have shown increased interest in Bitcoin.
BlackRock, among other institutions, applied to introduce Bitcoin exchange-traded funds (ETFs) earlier this year.
Additionally, the first BTC ETF was recently launched in Europe. The Sultanate of Oman revealed its investment strategy for Bitcoin mining infrastructure, committing over $1 billion.
Likewise, Hong Kong took steps to regulate cryptocurrencies, seeking to establish itself as a hub for digital asset companies.
Despite these potential catalysts, Bitcoin’s price remains unaffected, leading some to describe the market’s current state as a ‘bear market modus’ due to the persistent decline over the past two years.
Poppe highlighted the market’s ongoing ‘time capitulation’ phase, emphasizing that transitioning between market cycles often requires a considerable amount of time in the cryptocurrency sector.
He advised investors to maintain their composure during these trying times and to assimilate the lessons they’re learning for future market trends.
As of writing, Bitcoin’s price stands at $25,994 marking a decrease of 0.40% so far today. The cryptocurrency has seen a reduction of over 0.48% in the past week and has plummeted by more than 11% in the last month.
Considering the prevailing cryptocurrency market condition, THORChain, Wall Street Memes, dYdX, Sonik Coin, and Bitcoin SV are some of the best cryptos to buy now, given their firm fundamentals and/or promising technical analysis.
THORChain’s (RUNE) Bullish Trend: A Continuation or a Break?

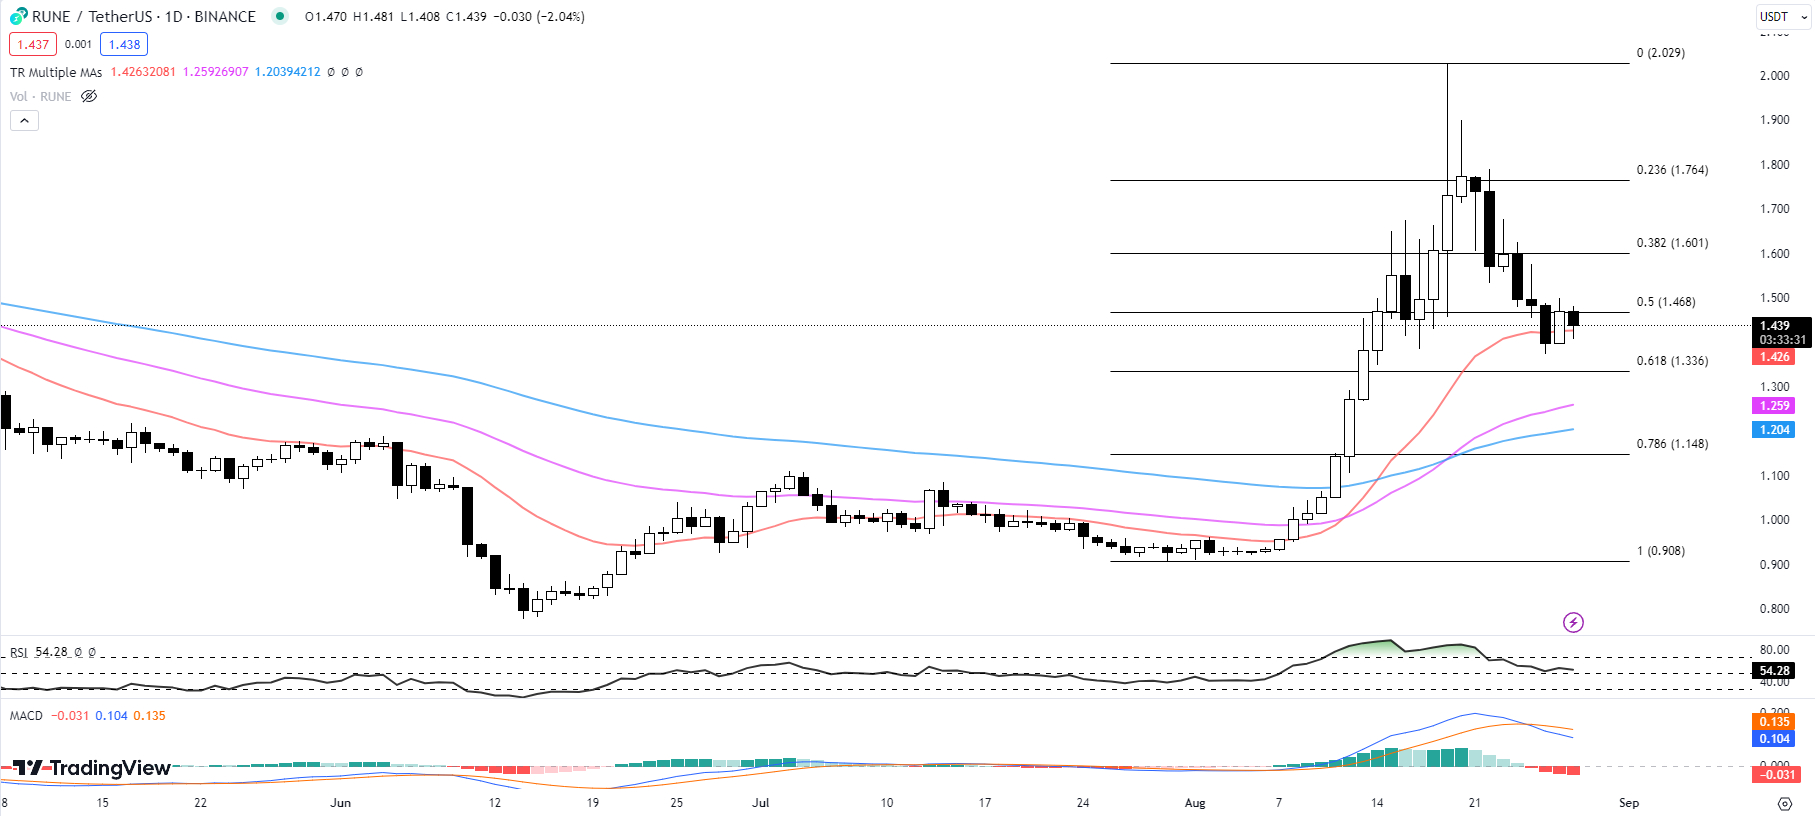
THORChain (RUNE) has demonstrated a stellar performance for the past month, with a remarkable uptrend for the first 19 days of August, amassing gains of over 116%.
However, since registering a year-to-date high of $2.029 on August 19, RUNE has been charting a retracement, losing almost 30% from its peak.
RUNE has currently found support at the 20-day EMA and is attempting a potential breakout from the Fib 0.5 level at $1.468.
Looking closer at the technical indicators, the 20-day EMA stands at $1.426, just below the current price of $1.439.
This suggests that the EMA is providing immediate support for the price, helping to prevent further downward movement. If RUNE manages to hold above this level, it could indicate a continuation of the bullish trend.
Additionally, the 50-day EMA and the 100-day EMA stand at $1.259 and $1.204 respectively. These levels represent additional layers of support that could potentially halt further price depreciation, should the 20-day EMA support be broken.
The RSI currently sits at 54.28. This level, while above the midline, is relatively neutral. It implies that neither the bulls nor the bears have a firm grip on the market. However, the fact that it’s more than 50 signifies a slight bullish bias.
The MACD histogram currently stands at -0.031. This negative figure indicates that the bears have been in control recently.
Yet, the relatively small magnitude suggests that it may not be a strong bearish trend and could possibly reverse with the right market stimuli.
The next major resistance level stands at the aforementioned Fib 0.5 level at $1.468. A successful breakout above this level could signal a continuation of the uptrend.
However, should the price fail to break this resistance, and instead break the 20-day EMA support, then the next level of support is at the Fib 0.618 level at $1.336.
While RUNE has seen a significant retracement from its recent high, the technical indicators suggest that it remains in a precarious position.
Its future direction hinges on whether it can hold support at the 20-day EMA and break the resistance at the Fib 0.5 level. Investors and traders should closely monitor these key levels in the coming days to make informed decisions.
Wall Street Memes: One of the Best Cryptos to Buy Now Amid Market Uncertainty
Even as the crypto market faces uncertainty, the new meme coin Wall Street Memes ($WSM) has successfully etched an impressive feat, raising $25 million and counting in its $WSM token presale.
The team spearheading $WSM shares a strong bond with the legendary WallStreetBets Reddit community, which is notorious for its synchronized buying strategy that sparked off the monumental GameStop short squeeze.
In addition to its ties to a preexisting meme-investing community, Wall Street Memes has caught the attention of tech billionaire Elon Musk.
Musk is known for his ability to influence prices in the meme coin sector, most notably with Dogecoin. His apparent interest signals upside potential if he tweets about $WSM.
But Wall Street Memes is more than just hype and celebrity endorsements. The project has a well-designed token distribution plan, with 50% of the 2 billion $WSM supply reserved for presale participants. Another 30% will go towards incentivizing community participation.
$WSM also seeks to differentiate itself with a staking feature that enables yields up to 101% APY for holding tokens. High staking rewards encourage long-term holds, which can stabilize prices after the presale ends.
The team plans for $WSM to list on major exchanges within weeks after the presale concludes. The price often sees a spike upon crypto exchange listings, so getting in during the presale could mean potential substantial returns.
Participants in the presale will also have the opportunity to access an airdrop worth $50,000, thereby attracting more interest. So far, the initiative has drawn more than 86,000 entrants.
While the market faces turbulence, Wall Street Memes remains on an upward trajectory. Its association with an existing meme community, endorsements from A-list celebrities, staking rewards, and plans to list on exchanges contribute to $WSM being one of the most notable crypto projects currently outperforming market trends.
Visit Wall Street Memes Now
DYDX: Potential Breakout Looming Despite Sideways Trading

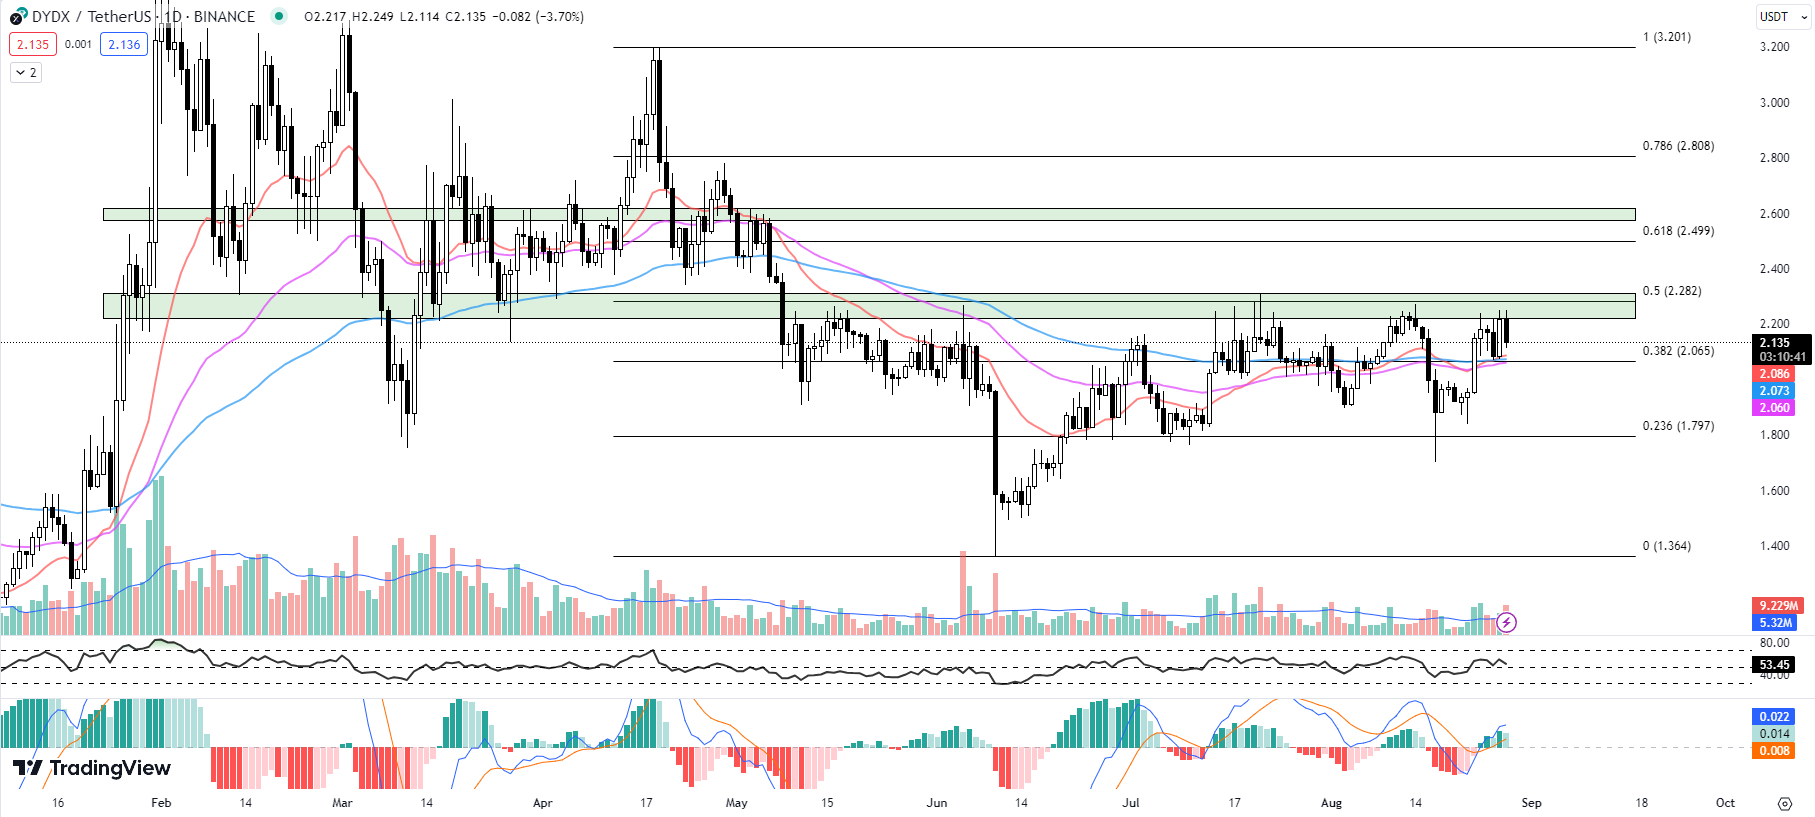
DYDX has been in a period of sideways trading since May 8. However, an analysis of several technical indicators suggests that a potential breakout could be on the horizon, despite a 3.70% downturn so far today.
DYDX’s current price is $2.135, down 3.70% from its previous close. However, the cryptocurrency is still trading above the key Exponential Moving Averages (EMA) levels, including the 20-day EMA ($2.086), 50-day EMA ($2.060), and 100-day EMA ($2.073).
The fact that the price remains above these averages for the specified time frames signals an overall bullish trend.
Additionally, the RSI is currently at 53.45, down from yesterday’s 58.89. While this decrease might seem concerning, the RSI value is still above the centerline of 50, indicating that the market is not oversold and there is room for price growth.
The MACD histogram has decreased slightly to 0.014 from yesterday’s 0.016. However, the MACD line is still in positive territory, still indicating bullish momentum.
One factor that might seem concerning is the 2.10% decrease in DYDX’s market cap to $488.6 million, and the substantial 42.48% decrease in the 24h volume.
Bear in mind, that these decreases could merely represent a temporary retracement before DYDX takes its next leg up.
Lower trading volumes can sometimes precede breakout movements as traders may be accumulating positions in anticipation of potential price increases.
Looking at key resistance and support levels, DYDX faces immediate resistance at the Fib 0.5 level at $2.282 in confluence with the horizontal resistance zone of $2.220 to $2.310. If DYDX can break through this resistance, it could trigger a new uptrend.
On the other hand, immediate support can be found at the Fib 0.382 level at $2.065, which coincides with the key EMA levels. This suggests a strong foundation of support if the price were to fall further.
Despite today’s downturn, the technical indicators are pointing towards a potential breakout for DYDX.
Traders should keep a close eye on these indicators and the key resistance and support levels as they navigate the market in the upcoming days.
Sonik Coin: Leveraging ’90s Nostalgia as One of the Best Cryptos to Buy Now
A beloved ’90s video game hero is the unlikely muse for the latest meme coin trying to go viral.
Sonik Coin, named after Sega’s Sonic the Hedgehog, has raced out of the gates by raising more than $648,000 in its first week of presale.
While not officially affiliated with Sega, Sonik Coin seeks to leverage the brand recognition of the beloved speedster.
The token’s developers have set a modest presale cap of $2 million, allowing substantial room for growth if momentum continues picking up.
The presale allocation accounts for 50% of the total supply, with the remainder set aside for staking rewards and exchange liquidity.
A key feature that sets Sonik apart from other meme coins is its staking rewards system, already live and accruing interest.
In just one week, over 23 billion tokens have been staked, representing over 15% of the presale supply. Staking provides holders with an estimated APY of 104% as of writing.
These staking incentives could support Sonik’s valuation after launch by reducing selling pressure as staked tokens are locked up for sustained periods.
Sonik Coin enters a crowded playing field of animal-themed meme tokens capitalizing on speculative mania.
While most quickly fade into obscurity, staking rewards may lend Sonik more solid fundamentals compared to other fleeting meme coins.
The legitimacy of the project has been reinforced by an audit of the smart contract code conducted by 0xGuard.
As meme coins continue to pique investor interest, Sonik Coin is carving its niche in the crypto market.
Should this new token successfully channel the speed and fun associated with its namesake, it could establish a robust community and tap into the ongoing crypto market enthusiasm for meme coins.
Visit Sonik Coin Now
Shift in Momentum: A Potential Bullish Move for Bitcoin SV?

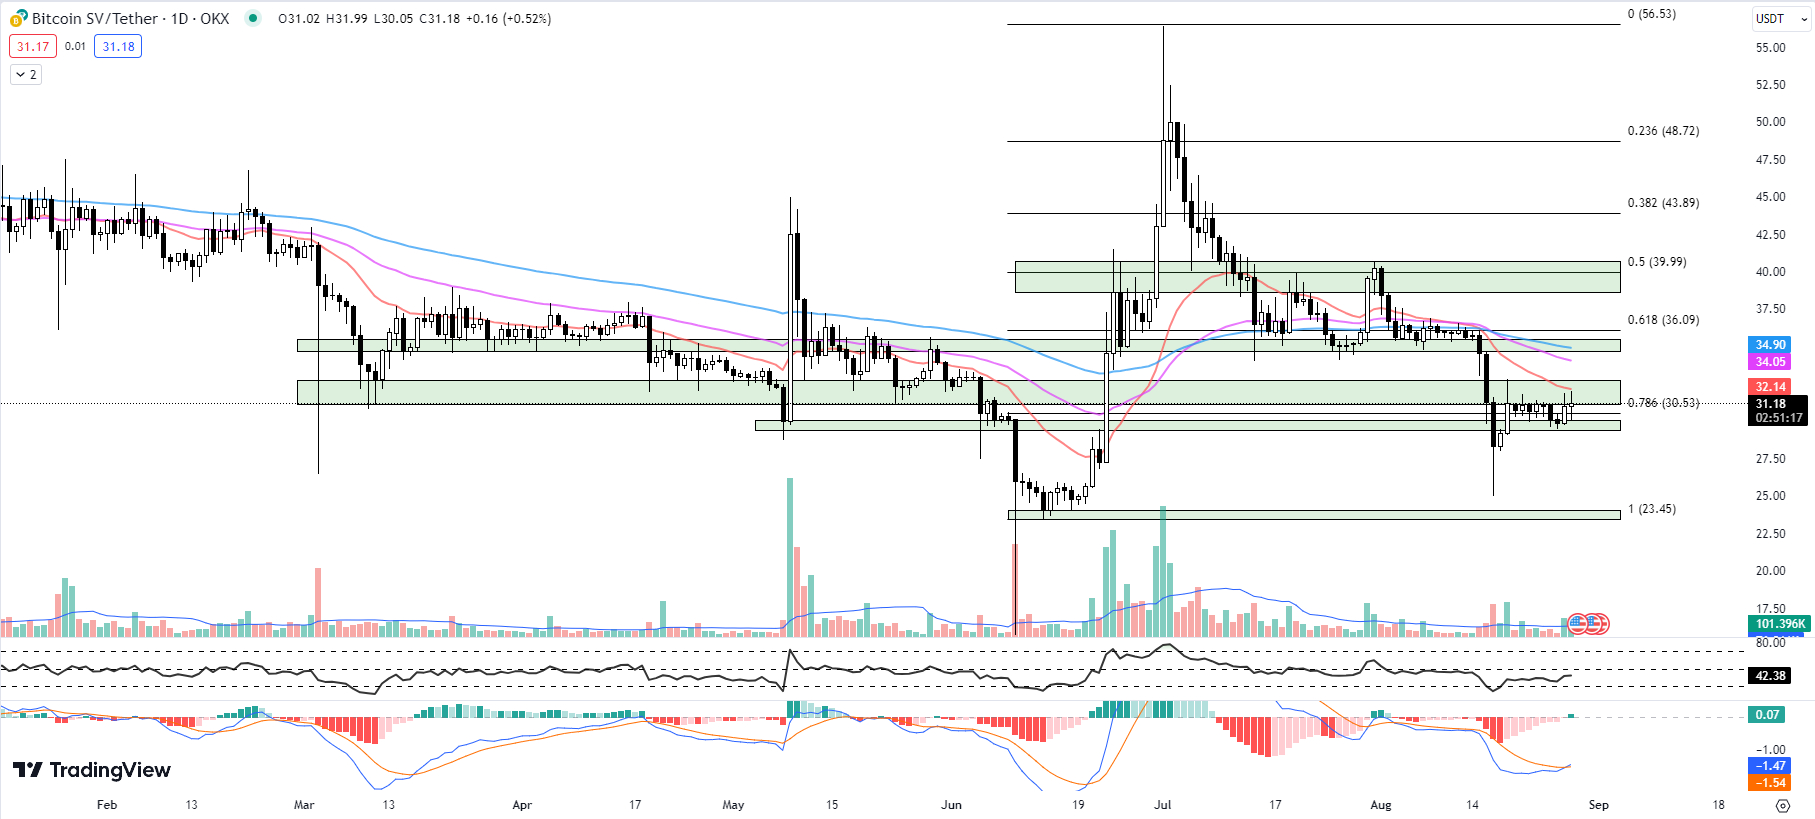
Bitcoin SV (BSV) has been locked in a tight consolidation range for the past nine days, flirting with the Fib 0.786 support level at $30.53.
As it nudges closer to a significant horizontal resistance of $31.17 to $32.78 and the 20-day EMS of $32.14, the cryptocurrency market is left wondering: Will BSV continue its bearish trend or is a breakout imminent?
The 20-day EMA, presently situated at $32.14, has proven to be a consistent indicator of short-term market sentiment over time.
Bitcoin SV currently trades beneath this benchmark, which typically implies a bearish market outlook.
This pessimistic perspective is further corroborated by the 50-day and 100-day EMAs, stationed at $34.05 and $34.90 respectively.
These values are only marginally higher than Bitcoin SV’s current trading price of $31.18, lending additional credibility to a bearish forecast.
The RSI is at 42.38, up slightly from yesterday’s 41.57. This is traditionally seen as a neutral zone, not indicating overbought or oversold conditions.
But, the slight uptick suggests a potential shift in momentum, which could be indicative of a future bullish move.
More promisingly, the MACD histogram, which is used to identify possible buy and sell points, shows a newly bullish crossover with a reading of 0.07, up from yesterday’s -0.02. This could be a sign that bulls are gaining control and a move upwards might be on the cards.
However, volume and market capitalization paint a mixed picture. The market cap has increased by 0.55% to $601.6 million, which could be interpreted as growing investor confidence.
At the same time, the 24-hour trading volume has dropped by 2.66% to $33.3 million, suggesting decreased trading activity.
The key resistance zone lies between $31.17 to $32.78, in confluence with the 20-day EMA of $32.14.
This intersection of resistance and EMA could be a strong barrier for BSV to overcome. However, if it does, this could trigger a potential bullish breakout.
The immediate support level is the Fib 0.786 level at $30.53, closely followed by the swing support range of $29.42 to $30.06.
Traders should watch these levels closely, as a drop below could signal a continuation of the bearish trend.
Despite the bearish undertone, the recent bullish crossover in MACD, the slight increase in RSI, and the rise in market cap point to a potential bullish breakout.
Traders should closely monitor these key resistance and support levels as BSV attempts to break out from its consolidation range.
Disclaimer: Crypto is a high-risk asset class. This article is provided for informational purposes and does not constitute investment advice. You could lose all of your capital.


