

LTCUSDT
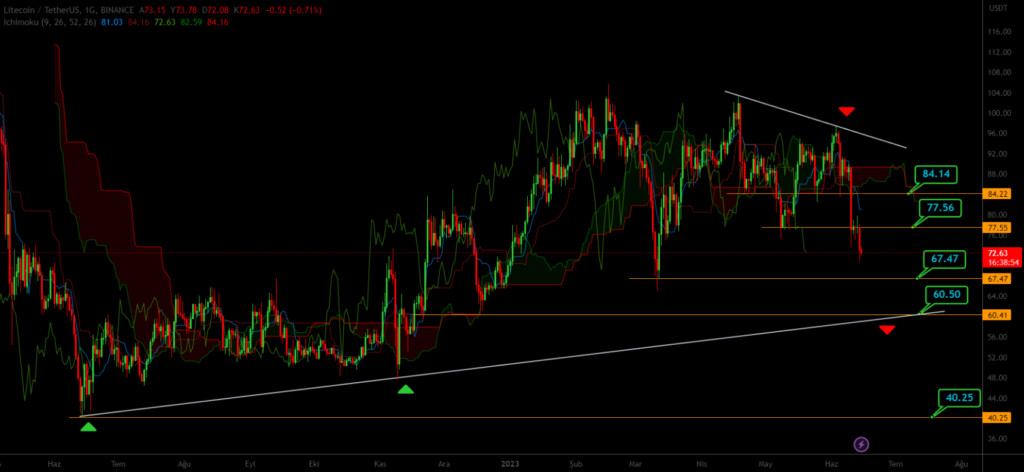
When examining the daily chart of LTCUSDT, it is observed that price movements are continuing along the trend line. Unless the cryptocurrency surpasses the level of 54.14, there is a possibility of a downward movement towards the level of 67.47, breaking below which it may further retreat to around 60.50. Additionally, if the price drops below the 60.50 level, a potential retracement towards the 40.25 levels could be expected.
LEOUSDT
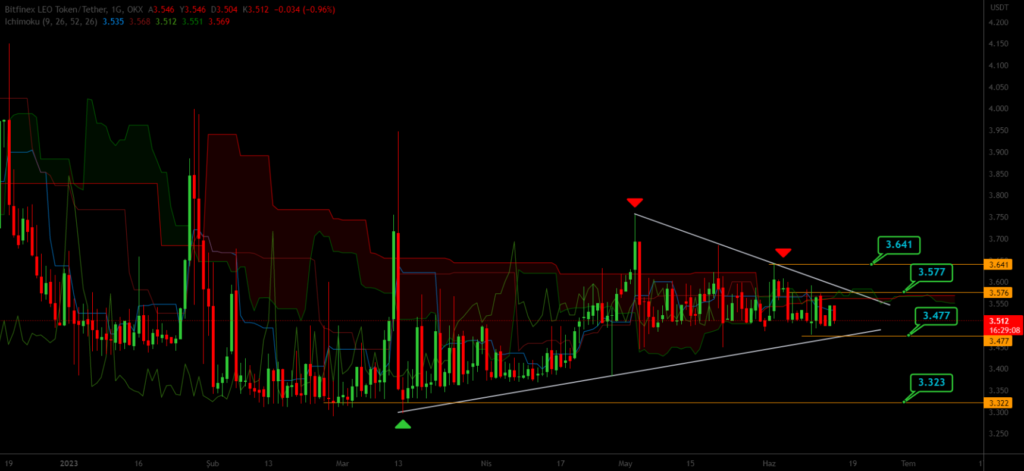
When examining the daily chart of LEOUSDT, it is observed that price movements are continuing within a triangle formation. Unless the cryptocurrency surpasses the level of 3.641, there is a possibility of a downward movement towards the level of 3.477, breaking below which it may further retreat to around 3.323.
OKBUSDT
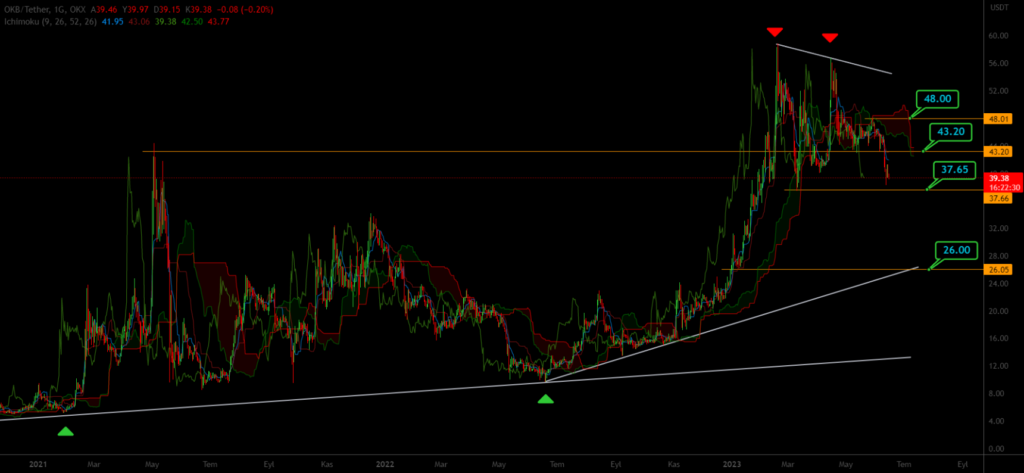
When examining the daily chart of OKBUSDT, it is observed that price movements are continuing with the formation of a double top pattern along the trend line. Unless the cryptocurrency surpasses the level of 48.00, there is a possibility of a downward movement towards the level of 37.65, breaking below which it may further retreat to around 26.00.