

TRXUSDT
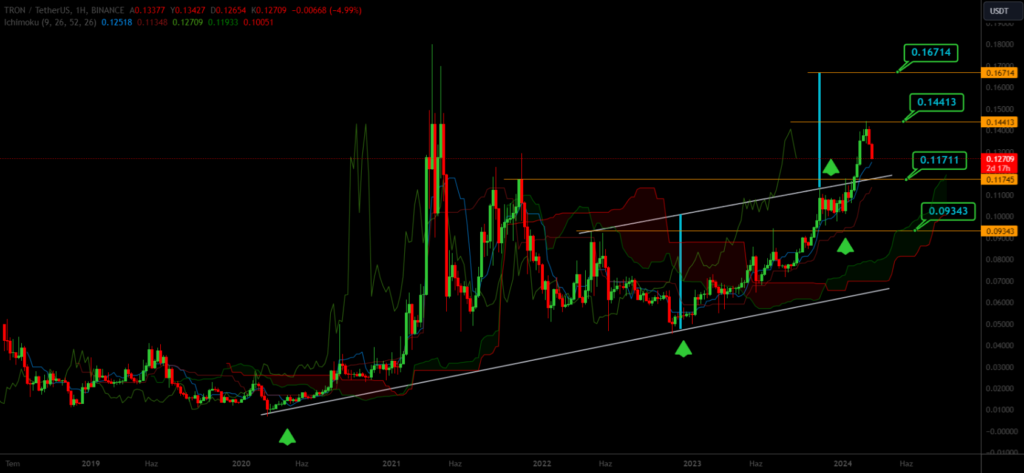
When examining the weekly chart of TRXUSDT, it is observed that the price movements continue above the trend line. As long as the 0.09343 level is not breached, it is considered that the price movements above the 0.11711 level could surpass the 0.14413 level and target the 0.16714 level.
KASUSDT
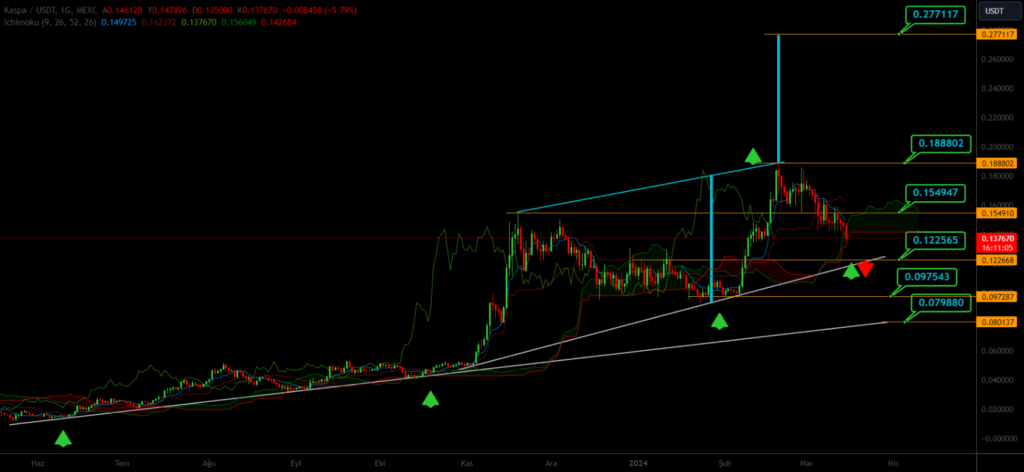
When examining the daily chart of KASUSDT, it is observed that the price movements continue above the trend line with the formation of a cup and handle pattern. While it is considered that the price movements below the 0.1225 level could break down to the 0.0975 level and potentially retract to the 0.0798 level, as long as the 0.1225 level is not breached, it is considered that the price movements above the 0.1549 level could surpass the 0.1888 level and target the 0.2771 level.