Best Crypto to Buy Now December 18 – Astar, Stacks, Injective


With the ASTR price surging over 136% shortly after its listing on Upbit, Stacks experiencing a surge of over 80% in the past month due to upgrade hype, and Injective once again making the push to new highs, are these three some of the best cryptos to buy now?
For those seeking overlooked Bitcoin Alternatives, meanwhile, Bitcoin ETF Token and TG.Casino lead as promising crypto presale options worth checking.
Best Crypto to Buy Now in the News
Astar’s utility token, ASTR, was listed on Upbit, potentially increasing the cryptocurrency’s market exposure.
What’s so special about December 18th? It’s the day Astar produced its first-ever block as a live network🎈.
Happy Birthday @AstarNetwork – 2 years! Besides the @Official_Upbit listing, we have some other presents ready for today 🎁. pic.twitter.com/JkJUPTQukb
— Maarten | Astar (@henskensm) December 18, 2023
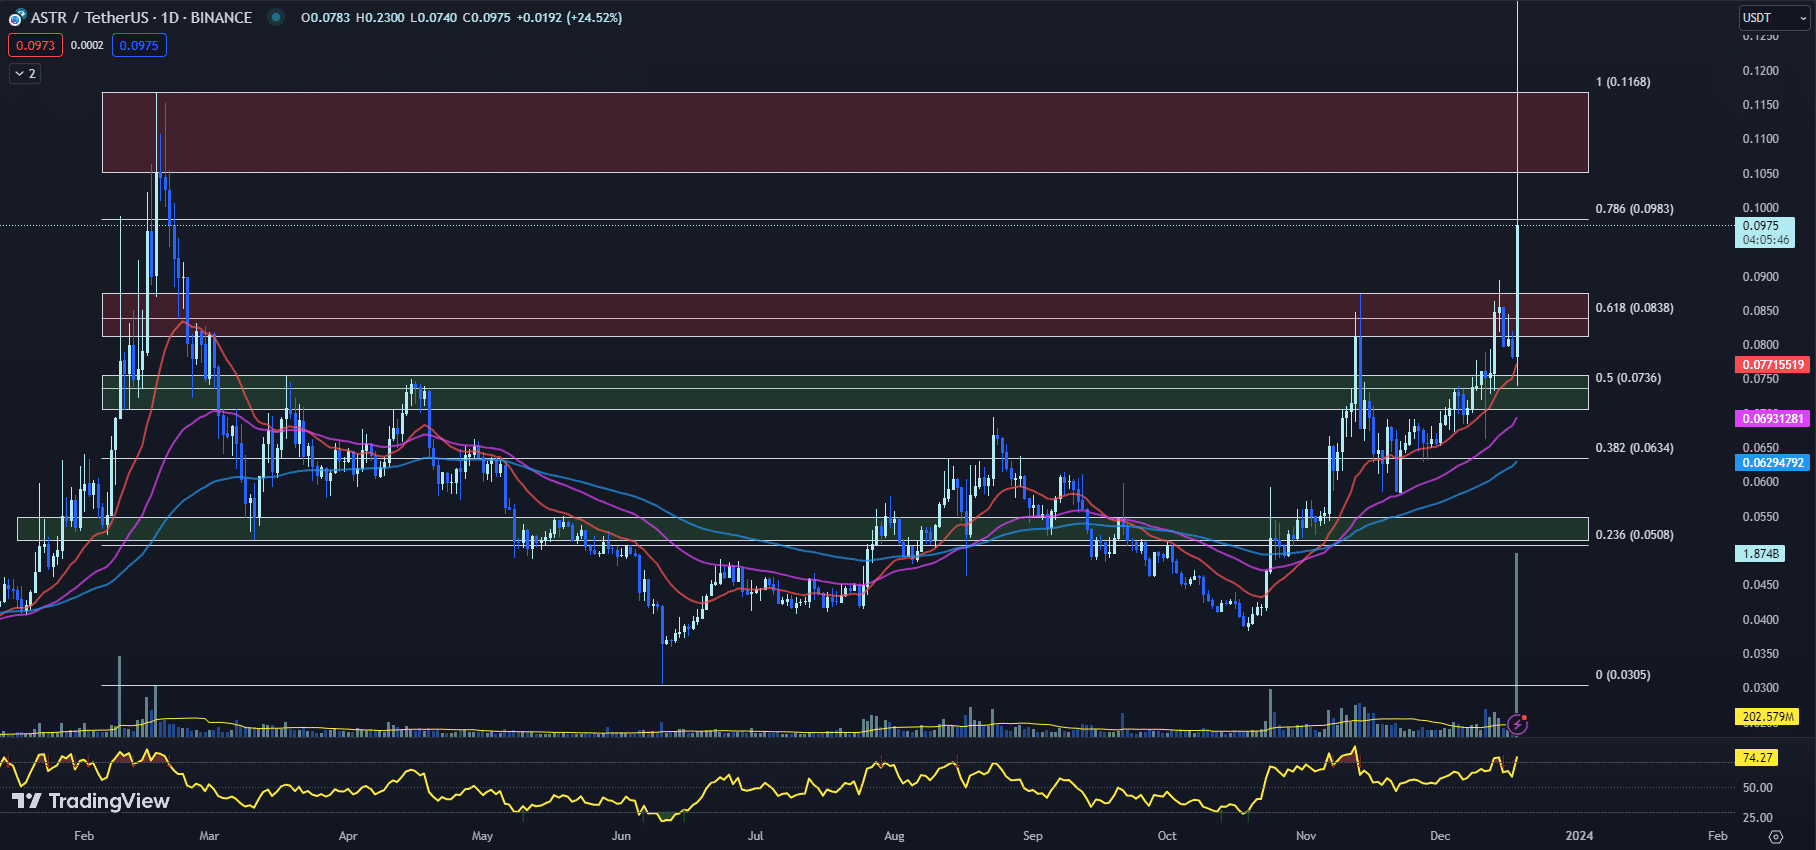
Following the listing, the ASTR price experienced a surge of about 136%, jumping to approximately $0.14, before correcting to the current levels of around $0.0975.
ASTR has climbed nearly 155% over the past year and has increased by over 51% in the past month alone.
Stacks has recently emerged as one of the top gainers among the leading 50 cryptocurrencies, with a notable 17% over the past week and an 84% rise over the past month.
With these gains, Stacks now stands as the 43rd most valuable cryptocurrency by market cap.
The Stacks network anticipates the Nakamoto upgrade in the first quarter of 2024, which is expected to bolster network security and speed up block generation.
Meanwhile, Injective Protocol’s native token, INJ, has witnessed a notable rally this year, culminating in an all-time high of $34.642 on December 15.
The token’s price has soared over 2,440% to its current levels since the beginning of the year.
Despite some signs of short-term consolidation, market sentiment around INJ remains bullish, with potential price targets around $40, assuming the token’s support level of around $20 holds firm.
Amidst the performance of established cryptocurrencies, new opportunities have arisen in the form of Bitcoin ETF Token and TG.Casino.
These crypto presales present fresh avenues for market participants to potentially diversify their crypto portfolios.
As the market continues to evolve, Astar, Stacks, Injective, Bitcoin ETF Token, and TG.Casino are currently positioned as some of the best crypto to buy now.
With the cryptocurrency market’s dynamic nature, these tokens offer varying potential for investors and traders monitoring the cryptocurrency space.
ASTR Price Surges 136% on Upbit Exchange Listing: A Closer Look

The recent surge in ASTR price, following its listing on the Upbit exchange, has captured the attention of investors and traders alike.
The cryptocurrency soared to a year-to-date high of $0.23, at one point marking an impressive 136% increase before experiencing a significant retracement.
Despite this pullback, the ASTR price has maintained a notable gain of 24.52% for the day, positioning itself at around $0.0975.
The technical indicators shed light on the ongoing momentum.
The ASTR price comfortably positions itself above the 20-day EMA ($0.0772), 50-day EMA ($0.0693), and 100-day EMA ($0.0629), a bullish sequence signaling strength in the upward movement.
Historically, prices sustaining above these exponential moving averages hint at a potential continuation of the trend, providing confidence to the bulls in the market.
The RSI for ASTR has soared to 74.27, indicating a market that may be overbought.
Typically, such a high RSI reading might give traders pause, suggesting that a period of consolidation or a pullback could be on the horizon.
However, it also reflects significant buying pressure, which could maintain the ASTR price at its current levels or even propel it higher in the short term.
The MACD histogram offers additional insights, now at 0.0013, a slight increase from yesterday’s 0.0004. This subtle shift suggests an addition in the bullish momentum.
Traders often look for more significant divergences in the MACD histogram to confirm a trend reversal, and as such, the current reading continues to support a bullish outlook. Resistance and support levels are crucial for traders to watch, however.
The ASTR price is nudging against immediate resistance in the range of $0.1052 to $0.1168, alongside the reverse Fib 0.786 level of $0.0983.
A decisive breakout above this band could clear the path for further gains.
Nonetheless, the earlier resistance range of $0.0812 to $0.0875, matched with the reverse fib 0.618 level of $0.0838, is expected to transform into support, thanks to the day’s positive price action so far.
Support levels underline the strength of the current trend, with immediate support now likely to be established around the $0.0812 to $0.0875 range.
The 20-day EMA at $0.0772 stands as the next line of defense, followed by an even more substantial support zone ranging from $0.0707 to $0.0756.
With these technical indicators in hand, traders could infer that while the ASTR price exhibits signs of a potential consolidation due to the high RSI reading, the positive stance above the EMAs and the bullish MACD histogram value suggest the upward trend still has the vigor to continue.
However, vigilance is warranted; close monitoring of the aforementioned resistance and support levels will be key to navigating the next phases of the ASTR price movement.
Trading strategies should be flexible, ready to capitalize on a confirmed breakout or to mitigate risks should the ASTR price face a reversal.
STX Price Rockets: Set to Break Year-to-Date Highs

The STX price has been charting a course for bullish territory, marking potentially its third consecutive day of gains.
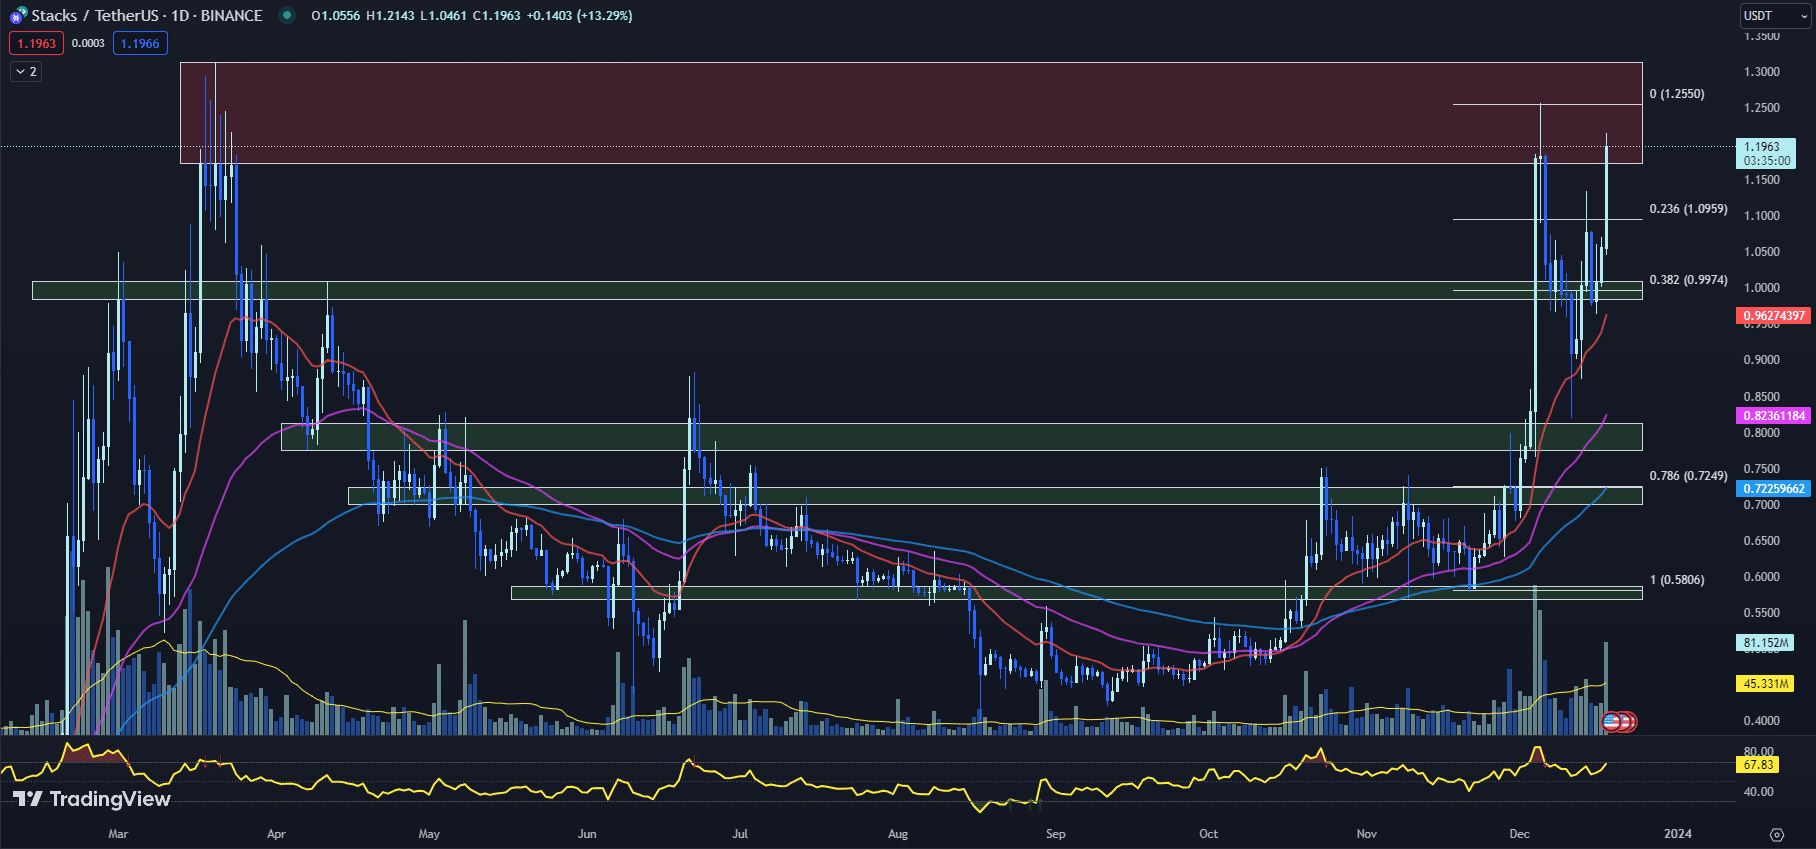
As it stands, STX is trading around $1.1963, marking a leap of 13.29% so far today.
The spotlight is on STX as it edges closer to setting a new year-to-date high, possibly eclipsing the March peak of $1.3115.
Technical indicators for Stacks (STX) are painting a narrative of bullish momentum.
The 20-day EMA of $0.9627, coupled with the 50-day EMA of $0.8236 and the 100-day EMA of $0.7225, underscores a robust uptrend.
The STX price floating above these EMAs suggests that the asset is on a strong bullish footing, with the moving averages serving as a dynamic level of support.
The RSI for STX further attests to the building momentum, posting a healthy 67.83, up from yesterday’s 61.30.
Although the RSI is nearing the upper echelon of the neutral zone, it remains shy of the overbought threshold of 70, which means there could still be room for the STX price to climb before investors should worry about a potential pullback due to overextension.
Perhaps the most striking development in the STX price technicals is the MACD histogram, which has flipped to 0.0064 from the previous day’s -0.0030, indicating a bullish MACD crossover.
Such a shift is often interpreted as a signal for a potential increase in buying pressure, further emboldening buyers to sustain or enter new positions.
The current trading price of $1.1963 is not only a testament to the day’s bullish sentiment but also a prelude to a potential challenge at the YTD swing high resistance levels ranging from $1.1733 to $1.3131.
The STX price, currently attempting to break through this ceiling, could find fertile ground for a rally should it succeed.
Conversely, the immediate support zone for STX lies between $0.9846 to $1.0096.
This region, in confluence with the psychologically significant $1 mark and the Fib 0.382 level of $0.9974, provides a strategic foothold for the STX price.
The ability of STX to maintain above this zone may be decisive for the short-term trajectory of the asset.
Given the bullish tilt of the technical indicators, STX traders might consider strategies that capitalize on the current momentum.
While the RSI has not yet signaled an overbought condition, it is prudent for market participants to remain vigilant as it approaches that zone.
The MACD’s bullish crossover presents an additional positive signal, suggesting that maintaining or initiating long positions could be favored until the technical outlook suggests otherwise.
In the immediate future, the STX price could continue to benefit from the bullish technical setup, provided it successfully breaches the current resistance.
A failure to do so, however, may lead to a retest of the immediate support levels.
Traders should monitor these key levels closely, as a breach below support could signal a short-term trend reversal and necessitate a reevaluation of bullish positions.
INJ Price Shows Strength Despite Slight Retracement

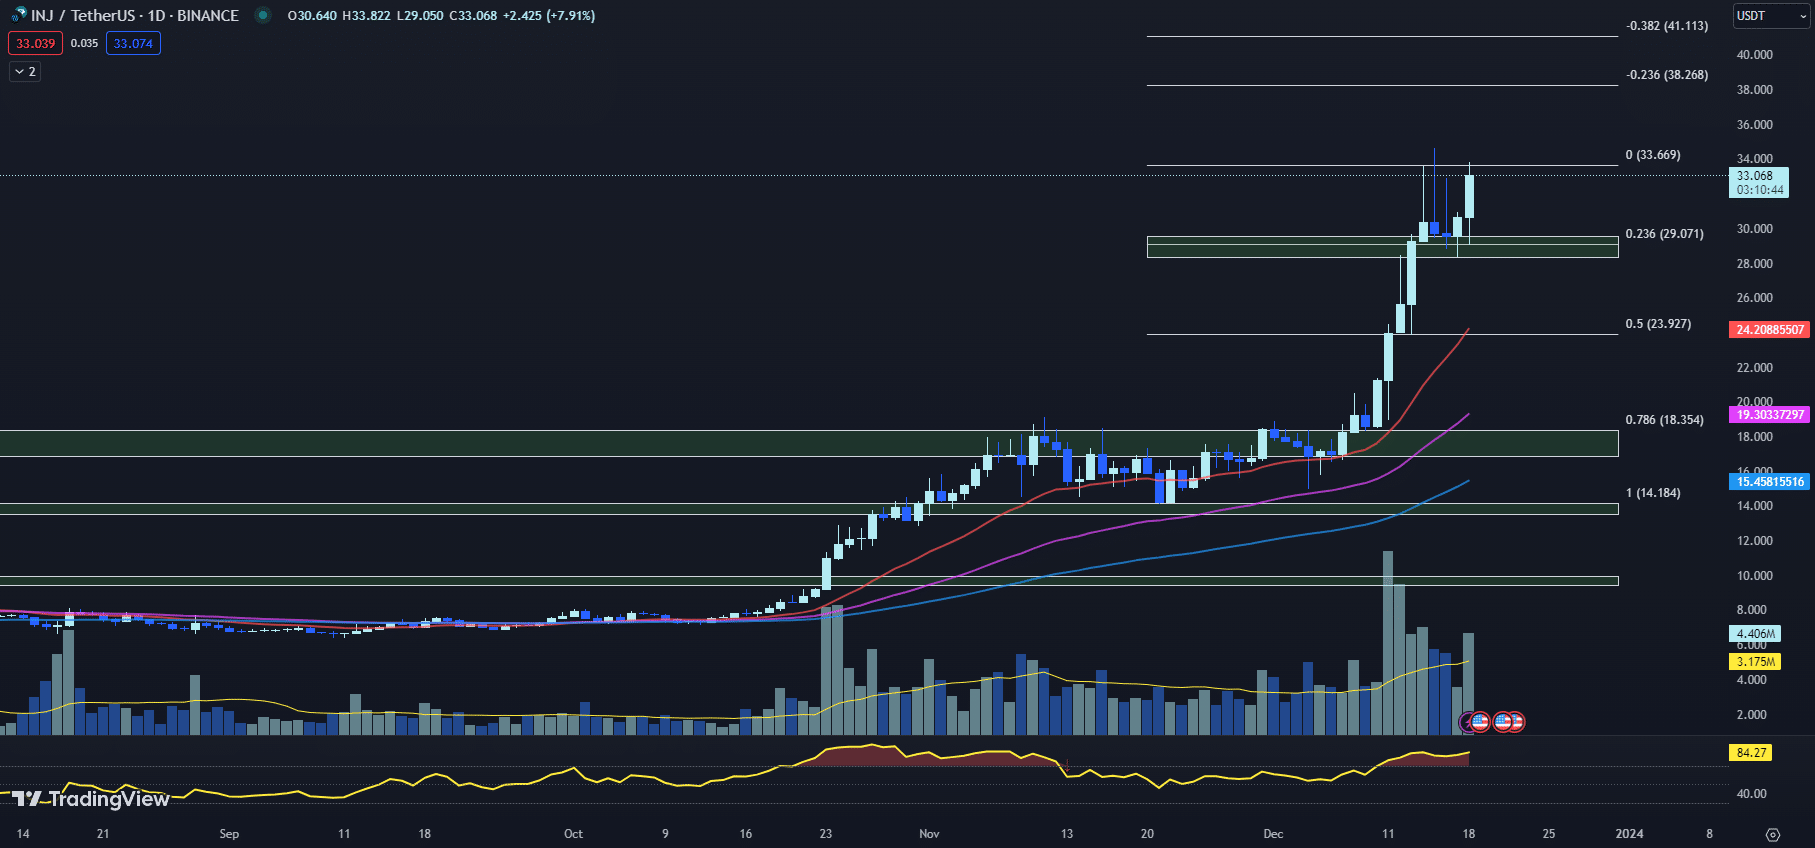
The INJ price has recently retreated from its all-time high of $34.642 set on December 15, settling near the Fib 0.236 level of $29.071.
Nonetheless, the INJ price is currently exhibiting resilience, trading at $33.07 and up by 7.91% so far today, indicating a potential continuation of its upward trajectory as it eyes a new all-time high.
The 20-day EMA for the INJ price is positioned at $24.209, well above the 50-day and 100-day EMAs, which are at $19.303 and $15.458, respectively.
This arrangement typically signals a strong bullish trend, with the INJ price maintaining a comfortable buffer above these key moving averages.
The elevated distance between the current INJ price and its EMAs may also support the notion of a sustained uptrend in the short to medium term.
An RSI reading of 84.27, climbing from the previous day’s 81.54, indicates a highly bullish momentum for the INJ price but also suggests that the asset is approaching overbought territory.
Such a high RSI often warrants caution, as it could precede a potential retracement if traders begin to believe the asset is overvalued and decide to take profits.
The MACD histogram’s value at 1.133, up from 1.105 the day before, aligns with the bullish sentiment, signaling a strong buying pressure as the gap between the MACD line and the signal line widens.
This could further embolden bullish investors to push the INJ price towards uncharted territories.
Looking at resistance levels, the INJ price has the immediate challenge of surpassing its current all-time high of $34.642.
Beyond that, the extended Fib levels of $38.268 (-0.236) and $41.113 (-0.382) represent the next psychological barriers that could influence trader sentiment and price action.
On the support side, the INJ price is buoyed by a horizontal support zone that ranges from $28.359 to $29.573, corroborated by the Fib 0.236 level of $29.071.
This confluence of support could prove to be a robust platform for the INJ price, potentially absorbing selling pressure should a retracement occur.
Given the strong uptrend indicated by the EMA values and the high RSI, traders might look to take advantage of any dips as buying opportunities.
However, the elevated RSI also serves as a cautionary tale, signaling the potential for a near-term pullback.
Investors should therefore consider setting stop losses to protect against sudden downturns, especially if the INJ price begins to falter below its immediate support levels.
In the coming days, market participants will likely keep a close watch on the INJ price as it grapples with the dual forces of enthusiastic buying and the natural resistance met at all-time high levels.
Should the INJ price decisively break above its current resistance, it could trigger a fresh influx of momentum buying.
Conversely, a failure to hold above the support zone might indicate a short-term top, prompting a deeper correction.
As always, traders should balance optimism with caution, aligning their strategies with both the technical indicators and the broader market sentiment.
With ASTR, STX, and INJ capturing the spotlight for their recent rallies, the crypto space remains filled with hidden gems waiting to be uncovered.
The Cryptoverse Beyond Bitcoin: Overlooked Bitcoin Alternatives For Savvy Investors
While Bitcoin continues to dominate the headlines, investors should also look past the hype and identify up-and-coming blockchain projects with promising capabilities before they take off.
Rather than chasing established cryptos with inflated valuations, the real opportunities lie in uncovering hidden gems early in their developmental cycles, before mass adoption.
Two under-the-radar cryptos worth evaluating closely are Bitcoin ETF Token and TG.Casino.
Securing a position early on through presale participation provides maximum upside exposure in these formative growth stages, though not without risks.
However, presale investment in strong projects with robust use cases can deliver potential returns down the road.
Rather than sticking with established brands, forward-thinking crypto investors will search below the surface to identify promising ventures still flying under the radar.
Uncovering these Bitcoin alternatives early and discerning their disruptive potential is the key to capitalizing on the crypto growth trajectory.
As crypto continues to gain mainstream traction, exciting breakthroughs lie ahead; however, the biggest gains will go to those who spot the hidden disruptors before they capture widespread attention.
Bitcoin ETF Frenzy Sees Btcetf Token Presale Raise $4 Million – Is It the Best Crypto to Buy Now?
The possibility of the SEC approving a spot Bitcoin exchange-traded fund (ETF) has created significant demand for a new presale token seeking to capitalize on the impending ETF frenzy.
The Bitcoin ETF Token has raised over $4.74 million so far, as eager traders buy up the Ethereum-based coin before it lists on major decentralized exchanges.
The presale will conclude once the fundraising goal of $5,059,485 is met, and with the presale currently in its 10th stage, fewer than $350,000 worth of $BTCETF tokens remain available for purchase at the discounted base price of $0.0068.
The much-anticipated debut of a #Bitcoin #ETF by @BlackRock might reshape the #Crypto landscape, drawing in institutional interest and sparking a fresh chapter in the market. 🌟📊
The last phase of #BitcoinETF is currently in full swing!
Keep an eye out for further news! 📰 pic.twitter.com/trfcw39aoU
— BTCETF_Token (@BTCETF_Token) December 18, 2023
The project’s one-of-a-kind tokenomics are designed to reward holders when major ETF-related milestones are achieved.
Burn mechanisms will reduce token supply at each key event, including SEC approval, official ETF launch, and targets for trading volume and assets under management.
As supply shrinks due to the burns, the scarcity price of remaining tokens will rise.
Additionally, the transaction tax decreases by 1% from the initial 5% rate at each of the first five milestones.
These milestones are $BTCETF hitting $100 million in trading volume, SEC approval of a spot Bitcoin ETF, the launch of the first spot ETF, ETF assets reaching $1 billion, and Bitcoin’s price closing above $100k.
Speculators forecast possible short-term returns if a spot Bitcoin ETF notably expands the scope of crypto investing.
In the long term, countries adopting Bitcoin as a reserve asset against inflation could also boost gains.
Crypto investors can still participate in the presale by connecting their wallet on the Bitcoin ETF Token website and purchasing tokens with ETH, BNB, MATIC, or USDT.
With the presale price still accessible, the Bitcoin ETF Token offers a compelling way to gain exposure to the monumental crypto investment shift that may unfold if the SEC approves a spot Bitcoin ETF.
Visit Bitcoin ETF Token Now
TG.Casino: The Best Crypto to Buy Now for Blockchain Casino Exposure
The Telegram-based crypto casino TG.Casino has raised over $4.49 million so far in its ongoing $TGC token presale.
With nearly 90% of the allotted 40% token supply already sold, the presale is on pace to hit its hard cap of $5 million shortly.
🐳 WHALE ALERT 🐳
Someone recently bought about $100k worth of $TGC 🤩
See you at $4.5 million in a little while🤝 pic.twitter.com/Je4QL2WOgn
— TG Casino (@TGCasino_) December 18, 2023
According to the project, player deposits have exceeded $4.5 million since its launch.
The Telegram-based gambling platform currently boasts nearly 3,000 users and over 11,000 channel members.
Players have wagered more than $45 million on the site to date.
The presale offers part of the total supply of 100 million $TGC at increasing prices, currently $0.19 and rising by $0.005 every 5 days.
Major whales have recently jumped in to secure $TGC at current low prices before the presale sells out.
Their large investments signal strong confidence in the project among crypto investors.
TG.Casino intends to be a top blockchain-based casino and gaming ecosystem.
The project holds a gambling license in Curaçao and has passed audits certifying its legitimacy.
Unlike competitors, TG.Casino offers fee-free staking rewards of up to 146% APY on purchased $TGC tokens.
More than 75% of all sold tokens have already been staked, highlighting strong engagement from the community.
As presale demand rapidly accelerates toward the hard cap, crypto analysts tout TG.Casino’s $TGC token as potentially the best crypto to buy now for those seeking exposure to a breakout in the blockchain gaming sector.
Its staking rewards, bonuses, and other features give TG.Casino has notable advantages over rivals.
Visit TG.Casino Now
Disclaimer: Crypto is a high-risk asset class. This article is provided for informational purposes and does not constitute investment advice. You could lose all of your capital.


