Shiba Inu Price Prediction – Can the Meme Coin Maintain its Momentum in 2023?

The crypto market has managed to successfully wobble through the banking crisis in the United States, which is gradually spreading to other parts of the world, particularly in Europe. Shiba Inu price stayed relatively stable, with the buyer congestion at $0.00001 holding tightly in place.
In addition to the banking crisis, which has left many investors unsettled and regulators seemingly blaming the crypto industry, the US Federal Reserve FOMC meeting resolved to raise interest rates by 0.25% earlier this week, depriving the market of enough momentum to keep moving up.
Over the last 30 days, SHIB has lost 19% of its value to trade at $0.00001061 at the time of writing. The second most popular meme coin is down 5% in seven days although price data from CoinGecko shows a 3.2% gain in 14 days.
Shiba Inu’s market value has remained relatively unchanged in the last 24 hours despite Bitcoin and Ethereum, the two top cryptocurrencies, falling by 2.3% and 3.2%, respectively. With the declines spread across the board, the total market cap is down by 1.5% to nearly $1.2 trillion.
Shiba Inu Price On the Verge of A Wedge Breakout
Two critical levels have generally determined how Shiba Inu price has responded to uncertainties in the global market this week. They are the short-term resistance at $0.00001 and the short-term support at $0.00001.
It was a relief for the bulls when Shiba Inu halted the downtrend from its new 2023 high of $0.0000157 in early February. This allowed SHIB to tap into the liquidity at this level and rebound in the second week of March.

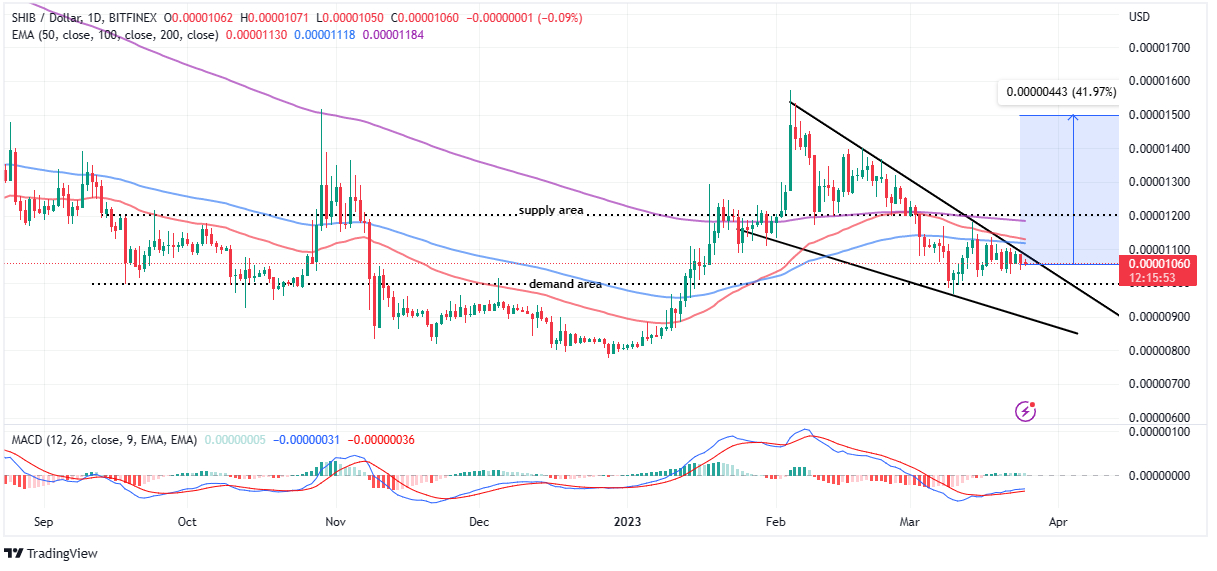
Although the recovery started with a lot of vibrancy, it did not last long as Shiba Inu barely brushed shoulders with $0.000012—a supply area coinciding with the 200-day Exponential Moving Average (EMA) (line in purple).
Another minor correction followed, leaving SHIB with no other option but to retreat and retest $0.00001. Now, bulls and bears are engaged in a fierce tug-of-war with neither willing to let go.
As a result, market indecision has engulfed the $6.3 billion crypto, the fifteenth largest in the market. This analysis attempts to evaluate Shiba Inu’s chances of resuming the uptrend and climbing first to $0.000015 so that it can create the foundation for the next move to $0.00002 as part of the investors’ quest to push SHIB above $0.0001.
A falling wedge pattern, formed as Shiba Inu dropped from the highs in February, is on the verge of handing over the reins back to the bulls. This is a trend reversal pattern that often comes into the picture after a long or significant pullback in the price of an asset.
Two trendlines, as shown on the daily timeframe chart, connect a series of lower highs and lows. Every time Shiba Inu has tried to push out of the pattern, bulls have lost the battle, culminating in more declines.
At the same time, the lower trendline has controlled the bearish push allowing the price to get closer to the wedge’s apex. In other words, this pattern allows for consolidation before the next big move in price.
Usually, a breakout is expected before the trendlines meet—and it is triggered by a move above the wedge pattern’s upside boundary. Traders often place limit orders slightly above the wedge, with the possibility of a 42% gain.
Realize that price movement above the wedge pattern would be characterized by increased volatility and volume. Profit booking can be progressive with traders exiting around the 200-day EMA ($0.000012) before activating new orders to $0.000014 and $0.000015, respectively to manage risk.
A close observation of the Moving Average Convergence Divergence (MACD) indicator reveals that buyers have the upper hand at the moment. A buy signal came into play when the MACD line in blue crossed above the signal line in red.
Traders waiting to activate buy orders may, however, want to wait until Shiba Inu price spikes above the wedge pattern and particularly the resistance at $0.00001 to avoid sudden risky pullbacks.
The potential movement of the MACD toward the mean line at 0.00 would also help to validate the bulls’ influence on the price.
Key Levels For Shiba Inu Price This Weekend – 2-Hour Chart
The short-term outlook for Shiba Inu is neither bearish nor bullish. However, some key levels and indicators could help traders make informed decisions.
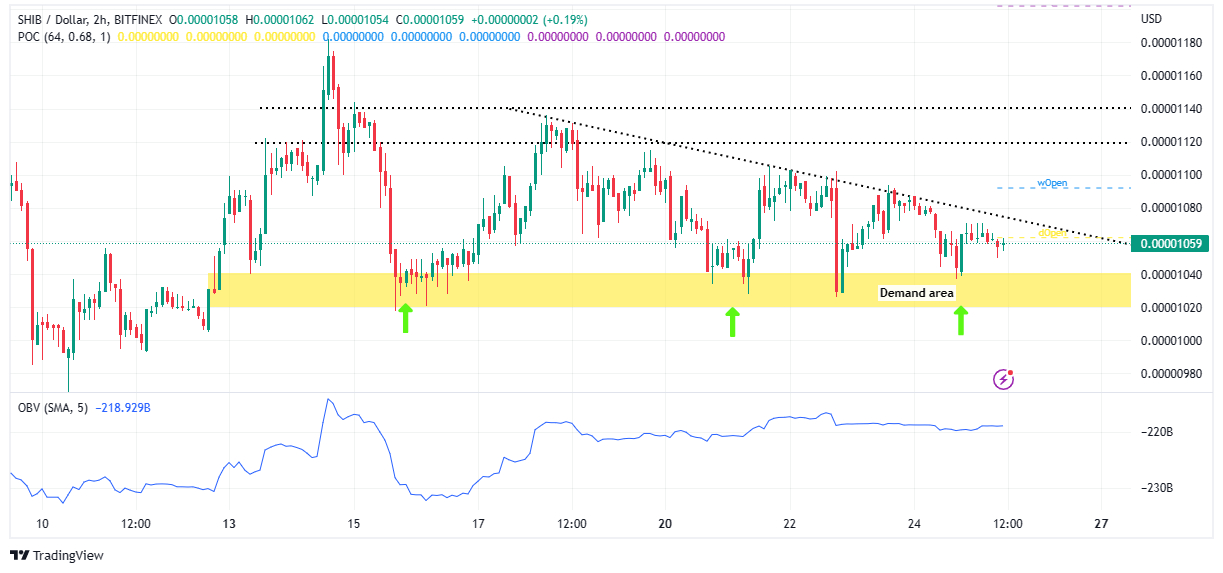
It is important to realize that Shiba Inu price is currently in consolidation, sitting comfortably on a massive buyer congestion zone between $0.00001020 and $0.00001040.
Every time SHIB has entered or touched this demand area, shown on the chart by the yellow band, it has increased substantially since the second week of March. Therefore, a retest of the same area could be bullish for the meme coin.

On the upside, Shiba Inu price is struggling to topple the daily open, as shown by the POC VAH indicator. For day traders, a break above this level at $0.00001062 could attract more buyers and build momentum to fight the trendline resistance.
If Shiba Inu price settles above the dotted trendline hurdle, we can acclimatize and prepare to see a retest of the weekly open at $0.00001092. For now, the push and pull between bears and buyers is likely to continue until the status quo is disrupted.
Related Articles:
- Nasdaq to Launch Crypto Custody Service to Meet Growing Market Demand – Here’s What You Need to Know
- Bitcoin Price and Ethereum Prediction: Weekend Breakout Possible Amidst Choppy Market Conditions
- Litecoin Price Prediction as LTC Rallies 38% From Recent Bottom – Can LTC Reach $100 in 2023?


